Report on the Evolution of the Balance of Payments and the International Investment Position – First Quarter of 2026

The quarterly report on the performance of Colombia’s balance of payments and the international investment position outlines the main results for the country’s current and financial accounts, as well as the evolution of their items.

 See the report (only in Spanish)

Publication Date:

1. Overall Results for the Balance of Payments

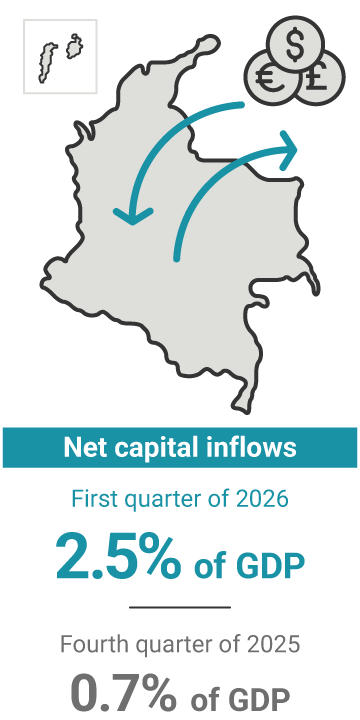
During the first quarter of 2026, Colombia’s current account of the balance of payments registered a USD 1,573 million (m) deficit, equivalent to 1.2% of the quarterly Gross Domestic Product (GDP). In turn, the financial account, including the variation in foreign reserves (USD 543 m), recorded net capital inflows for USD 954 m (0.7% of quarterly GDP). Errors and omissions were estimated at USD 619 m.

By components, the current account deficit (USD 1,573 million) in the first quarter of 2026 was driven by net factor income outflows amounting to USD 3,251 m, and the USD 2,906 m deficit in the trade balance of goods. These results were partially offset by net income from current transfers of USD 4,178 m and a surplus of USD 406 million in the trade balance of services (Graph 1).

Graph 1. Components of Colombia’s Current Account of the Balance of Payments

Figures in millions of U.S. dollars
Line and bar graph with quarterly data from 2019 to 2025; figures in millions of U.S. dollars. The graph shows four series: Trade balance of goods and services (orange bars), with negative values for most of the period, particularly from 2020 to 2022, reaching deficits close to USD -6,000 million. Factor income (gray bars), also negative throughout the entire period, fluctuating between approximately USD -1,000 million and USD -4,000 million. Current transfers (blue bars), consistently positive and increasing, rising from around USD 1,500 million in 2019 to more than USD 4,000 million in 2025. Current account (black line), which combines these components and remains negative throughout the period. It shows a deeper deficit in 2022, close to USD -7,000 million, followed by a partial recovery in 2023 and a decline again in 2025.
Figures as a percentage of GDP
Line and bar graph with quarterly data from 2019 to 2025; figures as a percentage of GDP. The graph shows four series: Trade balance of goods and services (orange bars), with negative values throughout the entire period, ranging from approximately −1.0% to −6.0% of GDP. Factor income (gray bars), also persistently negative, fluctuates between approximately −1.0% and −4.0% of GDP. Current transfers (blue bars), consistently positive and stable, standing between 2.0% and 4.0% of GDP, with a slight upward trend toward 2025. Current account (black line), which remains in deficit throughout all years. It shows deeper declines between 2021 and 2022, close to −6.0% of GDP, and a moderate recovery between 2023 and 2024 before deteriorating again toward 2025.

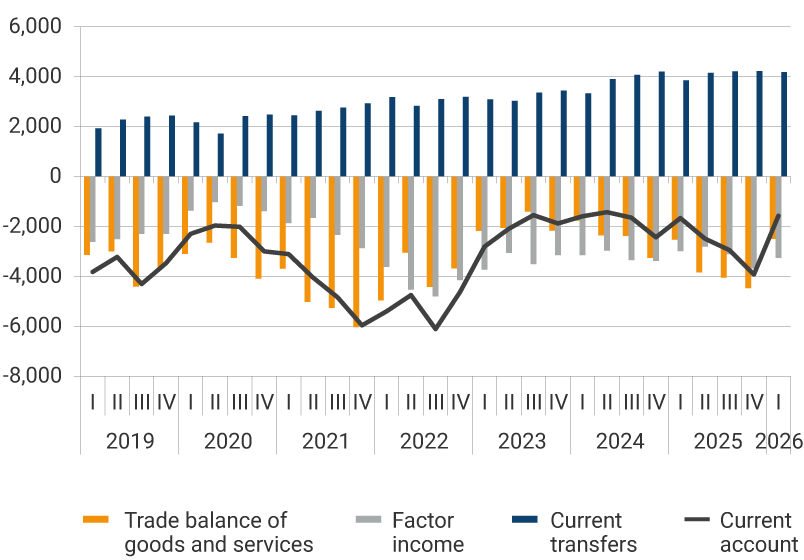
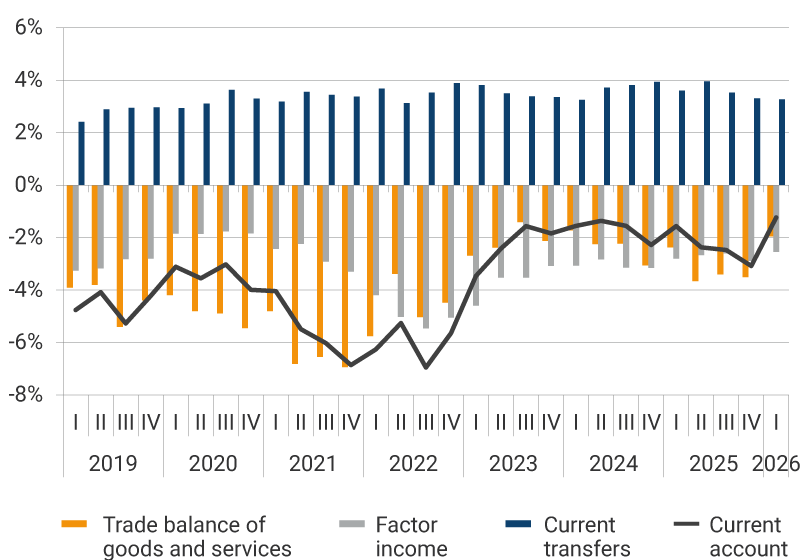
Source: Banco de la República (The Central Bank of Colombia)

As for the financial account for the first quarter of 2026, net capital inflows are estimated at USD 954 m, corresponding to foreign capital inflows (USD 8,346 m), Colombian capital outflows (USD 7,261 m), payments from non-residents to residents for gains on financial derivatives transactions (USD 411 m), and the increase in foreign reserves resulting from balance of payments transactions (USD 543 m) (Graph 2).

Graph 2. Components of the Financial Account of Colombia's Balance of Payments

Figures in millions of U.S. dollars
Line and bar graph with quarterly data from 2019 to 2025; figures in millions of U.S. dollars. The graph shows three series: A. Colombian capital outflows (red bars), with positive values representing investments or assets acquired abroad. These outflows increase gradually over the period, with peaks exceeding USD 8,000 million toward 2025. B. Foreign capital inflows (gray bars), with negative values throughout the entire period. The magnitudes range between USD -2,000 million and approximately USD -10,000 million, with larger declines between 2021 and 2022. Financial account (A + B) (black line), fluctuating between balances close to USD -2,000 million and USD -8,000 million. It shows a progressive deterioration between 2020 and 2022, followed by a partial recovery between 2023 and 2024 before declining again in 2025.
Figures as a percentage of GDP
Line and bar graph with quarterly data from 2019 to 2025; figures as a percentage of GDP. The graph shows three series: A. Colombian capital outflows (red bars), with positive values ranging between 0.0% and approximately 7.0% of GDP. These figures show marked increases between 2020 and 2021, followed by more moderate variations toward 2024 and 2025. B. Foreign capital inflows (gray bars), with negative values throughout the entire period, fluctuating between approximately −2.0% and −14% of GDP. The largest inflows are observed between 2021 and 2022. Financial account (A + B) (black line), reflecting predominantly negative balances. It remains between −3.0% and −10% of GDP, with a progressive deterioration between 2019 and 2022, a partial recovery during 2023, and a slight downward trend in 2024 and 2025.

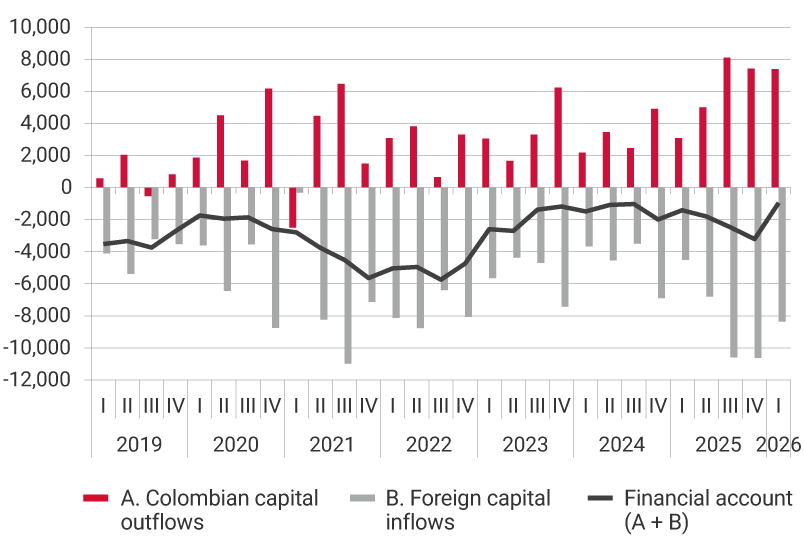
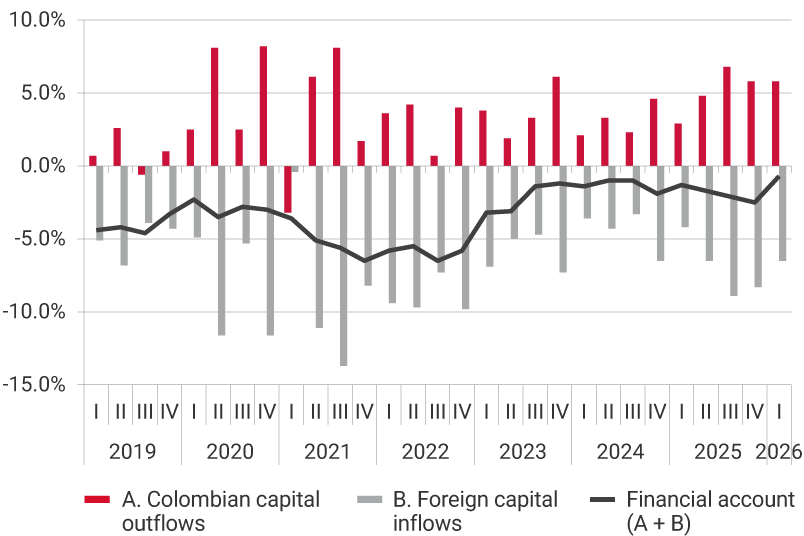
Note: Following the sixth edition of the International Monetary Fund’s Balance of Payments Manual, the financial account is presented with the same sign as the current account. For example, if the current account is in deficit, the financial account is negative, indicating that the economy resorts to external financing and/or liquidates its external assets to finance its excess current expenditure.
Source: Banco de la República.


2. Quarterly and Annual Evolution of the Current and Financial Accounts of Colombia’s Balance of Payments

(a) Current Account

The estimated current account deficit for the first quarter of 2026 (USD 1,573 million, or 1.2% of GDP) decreased by USD 2,351 million compared to the immediately preceding quarter. This performance was mainly driven by a lower deficit in the trade balance of goods, an increase in the net income from current transfers, the shift from a deficit to a surplus in the trade balance of services, and a reduction in net factor income outflows (Graph 1).

Compared with the first quarter of 2025, the current account deficit in the first quarter of 2026 was USD 91 m lower (0.33 pp of GDP). This performance was explained by higher net income from current transfers and a reduction in the trade balance of goods deficit. These effects were partially offset by higher primary income net outflows and a smaller services trade surplus.

The current account deficit in the fourth quarter of 2025 represented 3.1% of GDP, compared to 2.4% in the previous quarter.

(b) Financial Account

Net capital inflows of USD 954 m (0.7% of GDP) recorded in the financial account during the first quarter of 2026 decreased by USD 2,257 m compared to the immediately preceding quarter. This result was explained by lower external income from portfolio investment and increased acquisition of foreign assets, which was partially offset by higher foreign direct investment inflows.

Compared with the first quarter of 2025, the financial account in the first quarter of 2026 recorded lower net capital inflows by USD 457 m. This performance was mainly explained by the accumulation of deposits abroad and higher net repayments of foreign credits, partially offset by increased external financing through foreign direct investment and portfolio investment, as well as by larger sales of foreign portfolio assets.

Net capital inflows in the fourth quarter of 2025 represented 2.7% of GDP, compared to 1.9% in the previous quarter.

3. International Investment Position (IIP)

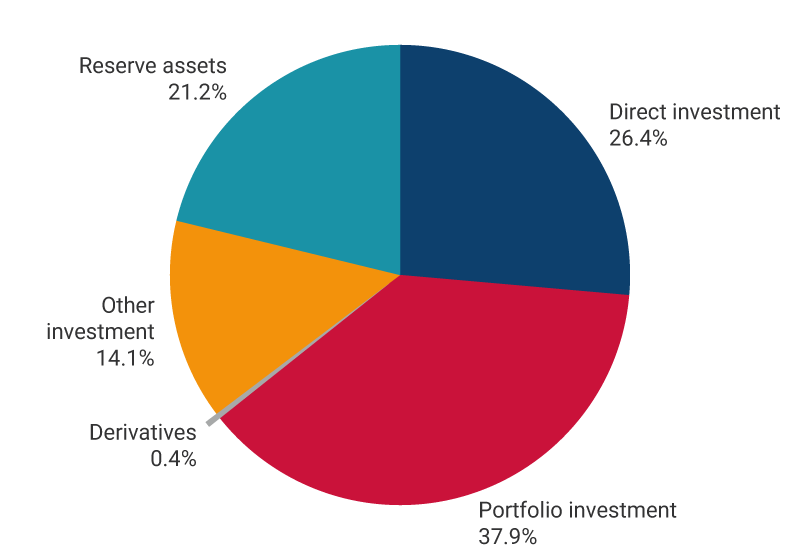
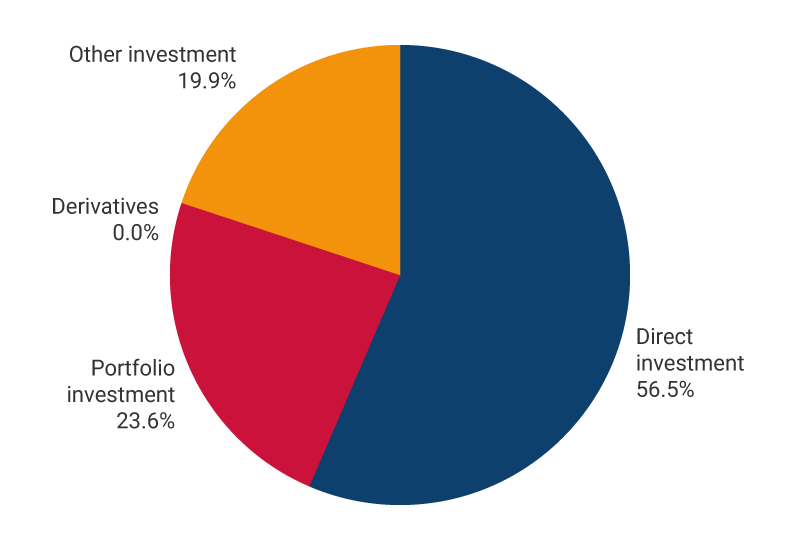
As of the end of March 2026, Colombia recorded a negative net international investment position of USD 203,566 m (42.5% of annual GDP), resulting from assets of USD 314,487 m (65.6% of annual GDP) and liabilities of USD 518,052 m (108.0% of annual GDP). Of the total asset balance, 37.9% corresponds to portfolio investments, 26.4% to Colombian direct investment abroad, 21.2% to reserve assets, and the remaining 14.5% to other assets, including loans, other foreign credits, deposits abroad, and financial derivatives. Liabilities are broken down into 56.4% foreign direct investment, 23.6% portfolio investment, and the remaining 19.9% other liabilities (where external loans stand out).

Graph 3. International Investment Position as of March 2026 (USD 203,566 m, 42.5% of GDP 1)

Assets
USD 314,487 m
The graph exhibits the percentages of assets in the international investment position as of December 2025. Direct investment, 26.6%. Portfolio investment, 38.1%. Derivatives, 0.4%. Other investment, 13.3%. Reserve assets, 21.6%.
Liabilities
USD 518,052 m
The graph exhibits the percentages of liabilities in the international investment position as of December 2025. Direct investment, 56.4%. Portfolio investment, 23.1%. Derivatives, 0.0%. Other investments, 20.6%.

1 The GDP figure in U.S. dollars corresponds to the sum of the last four quarters.

Report on Evolution of the Balance of Payments and International Investment Position (Complete issues - available since 2023)

This report describes the main results of the quarterly and annual evolution of the country's balance of payments.

Report on the Evolution of the Balance of Payments and the International Investment Position – First Quarter of 2026 Download (only in Spanish)Balance of payments statistics
Report on the Evolution of the Balance of Payments and the International Investment Position – Fourth Quarter of 2025 Download (only in Spanish)Balance of payments statistics
Report on the Evolution of the Balance of Payments and the International Investment Position – Third Quarter of 2025 Download (only in Spanish)Balance of Payments Statistics
Report on the Evolution of the Balance of Payments and the International Investment Position – Second Quarter of 2025 Download (only in Spanish)Balance of payments statistics
Report on the Evolution of the Balance of Payments and International Investment Position – First Quarter of 2025 Download (only in Spanish)Balance of Payments Statistics (only in Spanish)
Report on the Evolution of the Balance of Payments and International Investment Position - Third Quarter 2023 Download (only in Spanish)Balance of Payments Statistics (only in Spanish)

Note 01 September 2021: Current account statistics of the balance of payments were revised from 2015 to 2020 as a result of: i) the findings of the reconciliation exercise of external sector statistics and net lending of financial accounts published by Banco de la República and the Rest of the World Account of the System of National Accounts (SNA) disclosed by the National Administrative Department of Statistics (DANE in Spanish) that evidenced differences in the values of free trade zone exports; and ii) improvements in the sources of information and estimation methods implemented by Banco de la República between 2015 and 2020. As a result of the above, the current deficit was revised downward between 0.07 percentage points (pp) and 0.2 pp of Gross Domestic Product (GDP) in dollars for the periods 2015 and 2017. On the other hand, for the years 2018 to 2020, the revision implied an increase in the deficit level between 0.16 pp and 0.18 pp of GDP in dollars. The details of this revision can be consulted in the Statistical Review document of the current account of Colombia’s Balance of Payments. Statistical Review document of the current account of Colombia’s Balance of Payments (Only in Spanish).