Report on the Evolution of the Balance of Payments and International Investment Position – First Quarter of 2024
The quarterly report on Colombia's balance of payments and international investment position describes the main results for the country's current account and financial account, as well as the evolution of their items.
1. Overall Results for the Balance of Payments
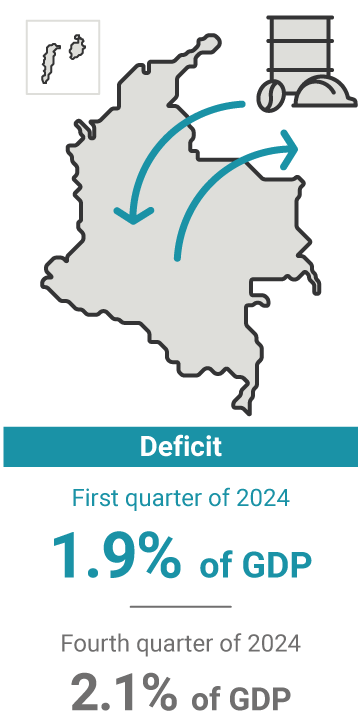
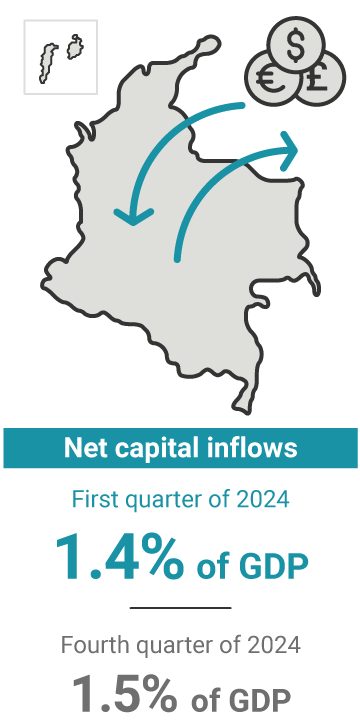
The current account of Colombia's balance of payments registered a deficit of USD 1,924 million (m) during the first quarter of 2024, which is equivalent to 1.9% of gross domestic product (GDP) for that quarter. The financial account, including the change in reserve assets (USD 951 million), showed USD 1,397 million in net capital inflows (1.4% of quarterly GDP). Errors and omissions were estimated at USD 527 m.
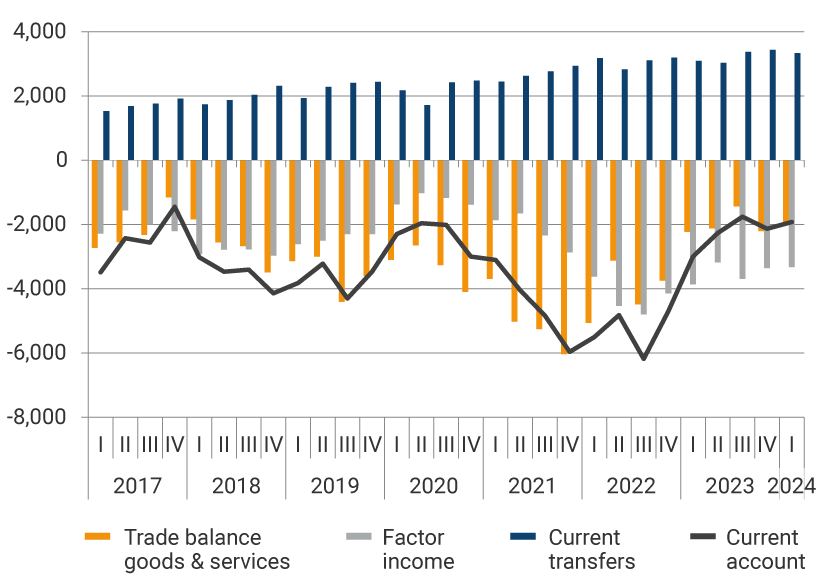
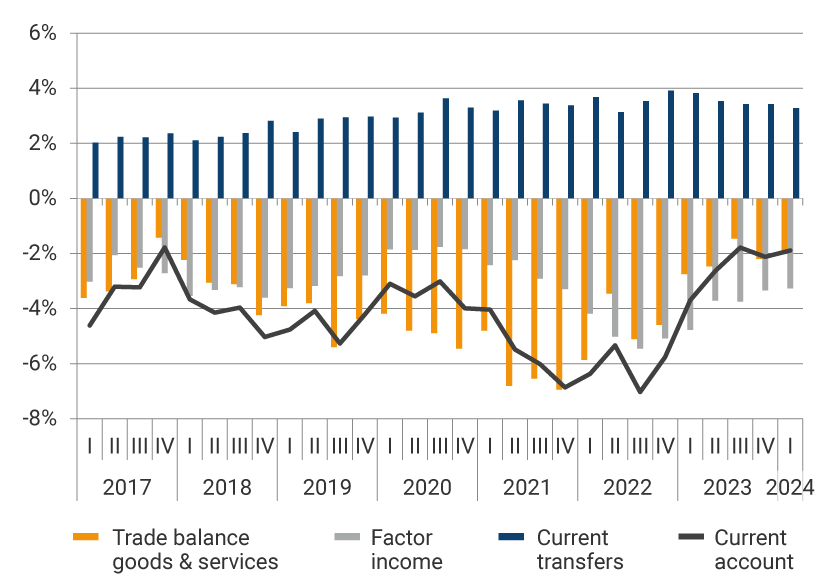
By components, the deficit in the current account (USD 1,924 m) for the first quarter of 2024 originates with USD 3,324 m in net factor income outflows and a deficit of USD 2,057 m in foreign trade in goods. These results were partially offset by net income from current transfers in the amount of USD 3,324 m and by the surplus in trade in services, which came to USD 125 m. (Graph 1).
Graph 1. Components of Colombia's current account balance of payments
Figures in millions of US dollars
Figures as a percentage of GDP
Source: Banco de la República (the Central Bank of Colombia)
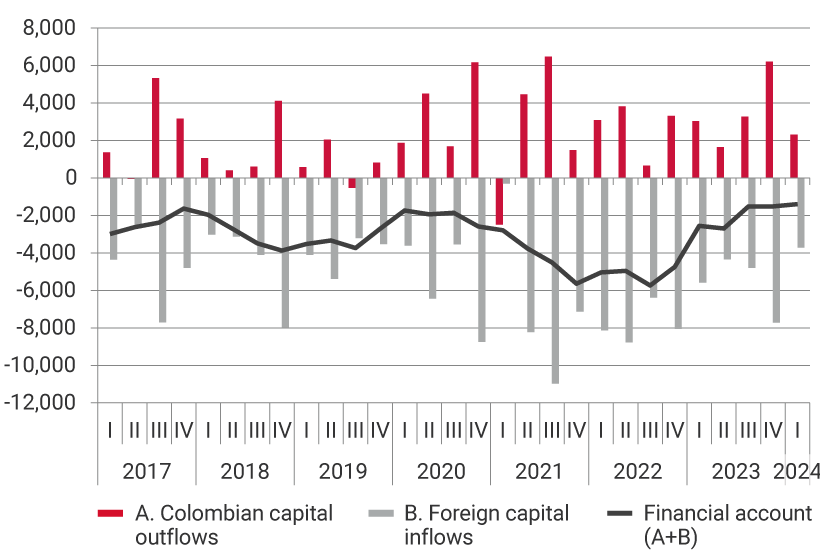
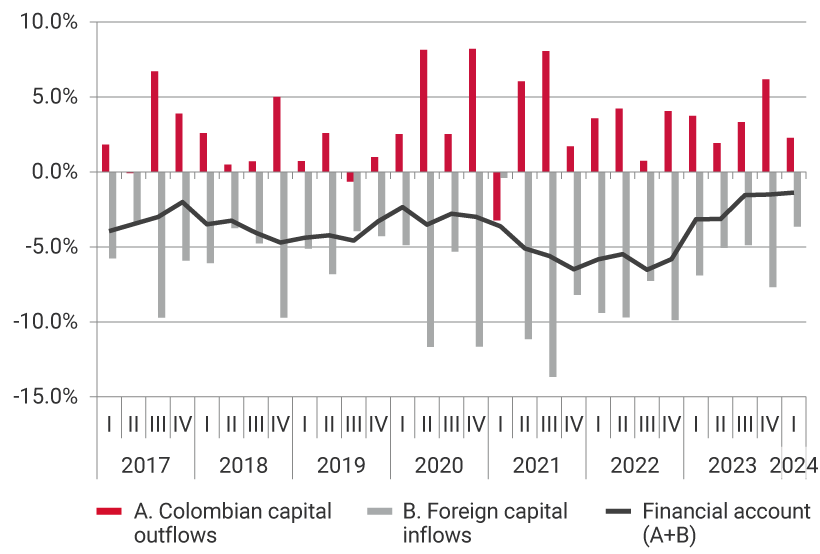
In the financial account for the first quarter of 2024, net capital inflows are estimated at USD 1,397 m. They pertain to foreign capital inflows (USD 3,711 m), Colombian capital outflows (USD 1,937 m), payments from non-residents to residents for gains on financial derivative transactions (USD 575 m), and the increase in international reserves due to balance of payments transactions (USD 951 m) (Graph 2).
Graph 2. Components of Colombia's financial account balance of payments
Figures in millions of US dollars
Figures as a percentage of GDP
Nota: According to the sixth version of the International Monetary Fund's Balance of Payments Manual, the financial account is presented with the same sign as the current account. For example, if there is a deficit in the current account, the financial account is negative, indicating that the economy is resorting to external financing and/or selling off its external assets to finance its excess current expenditure.
Source: Banco de la República
2. Quarterly and Annual Evolution of the Current and Financial Accounts of Colombia’s Balance of Payments
a) Current Account
The estimated current deficit for the first quarter of 2024 (USD 1,924 m, 1.9% of GDP) declined by USD 209 m with respect to the immediately preceding quarter, mainly due to the favorable variation in the trade balance for services and fewer net outflows of factor income, which were offset in part by the higher deficit in the balance for trade in goods and by less net income from current transfers (Graph 1).
The current deficit for the first quarter of 2024 is USD 1,072 m less (1.8 pp. of GDP) with respect to the first quarter of 2023, mainly because of the reduction in net factor income outflows, the favorable variation in the trade balance for services and the increase in income from current transfers. These results were partially offset by the wider deficit for trade in goods.
b) Financial Account
Net capital inflows of USD 1,397 m (1.4% of GDP) registered in the financial account during the first quarter of 2024 showed a reduction of USD 117 m compared to the immediately preceding quarter. This outcome is explained by less external financing from loans and portfolio investment, which was partially offset by the liquidation of deposits abroad.
Compared to the first quarter of 2023, the financial account for the first quarter of 2024 showed lower net inflows of USD 1,158 m. This momentum is mainly explained by less external financing from loans, and direct and portfolio investments, and by the liquidation of deposits abroad.
3. International Investment Position (IIP)
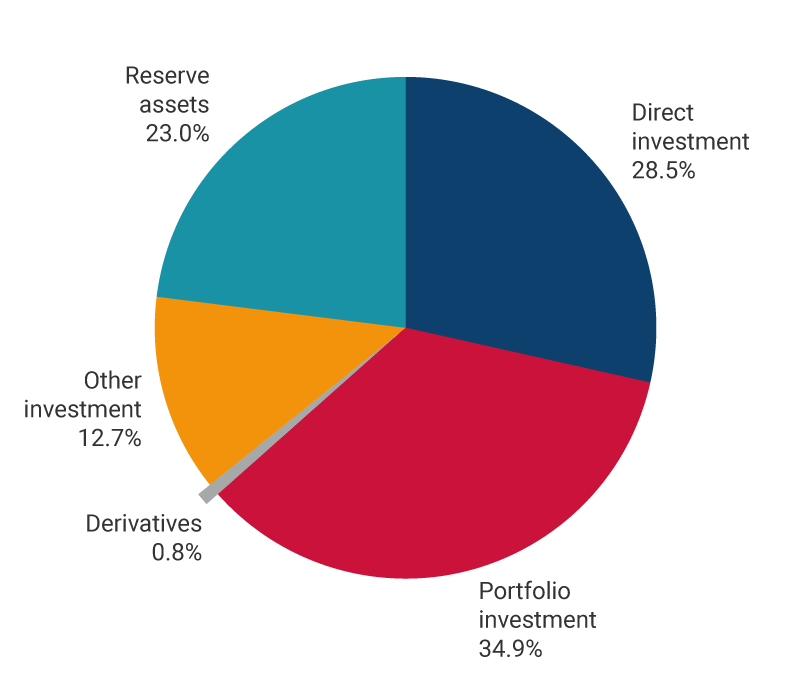
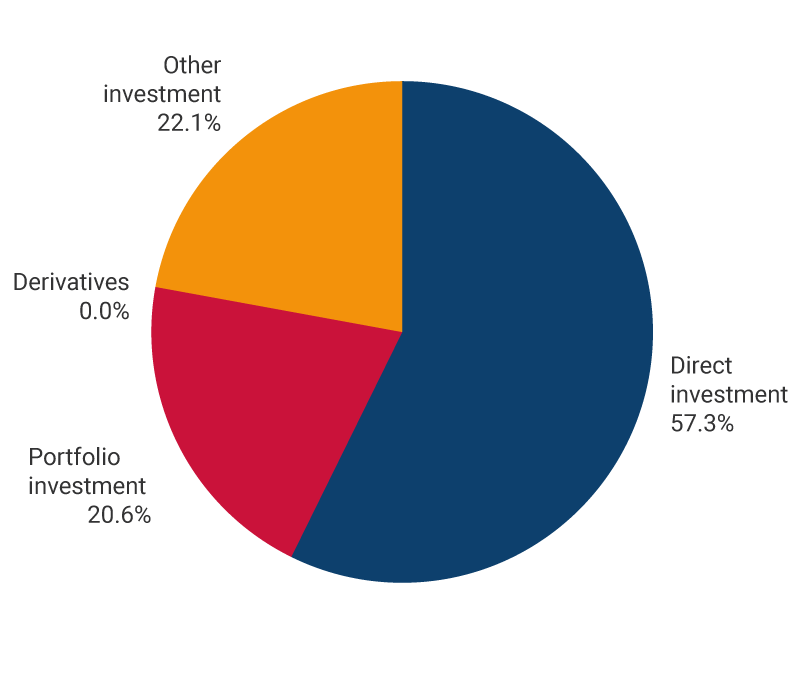
At the end of March 2024, Colombia registered a negative net international investment position of USD 191,085 m (49.4% of annual GDP), resulting from USD 260,761 m in assets (67.5% of annual GDP) and USD 451,846 m in liabilities (116.9% of annual GDP). As for the total balance of assets, 34.9% correspond to portfolio investment, 28.5% to Colombian direct investment abroad, 23.0% to reserve assets, and the remaining 13.6% to other assets, which include loans, other external credit, deposits abroad and financial derivatives. Liabilities breakdown as follows: foreign direct investment, 57.3% and other liabilities, 22.1% (particularly foreign loans), while the remaining 20.6% pertains to portfolio investment.
Graph 3. International Investment Position as of March 2024 (USD 191,085 m, 49.4% of GDP 1)
Assets
USD 255,909 m
Liabilities
USD 448,225 m
1 The GDP figure in US dollars corresponds to the sum of the last four (4) quarters.