Regional Economic Pulse - Third Quarter of 2026
The Regional Economic Pulse indicators and their report are constructed based on surveys to businesspeople and executives who are asked about their perception of the dynamics of their economic activity in the annual comparison and on available statistical information. It is prepared by the Regional Economies Section of the Technical and Economic Information Department of Banco de la República (the Central Bank of Colombia). The content is solely the responsibility of the authors and does not commit Banco de la República or its Board of Directors.
During the third quarter of 2026, economic activity in all regiones would have lost momentum compared with the previous quarter. Only Bogotá and the Northeast likely recorded year-on-year growth, supported by industry and transportation. The other regions likely experienced declines, with the sharpest deteriorations in the Southwest and Central Coffee regions, the areas most affected by the 10 August earthquake. High temperatures, which negatively affected agricultural output, together with the decline in new housing sales, also likely dampened dynamism.
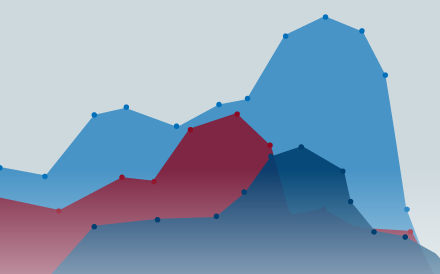
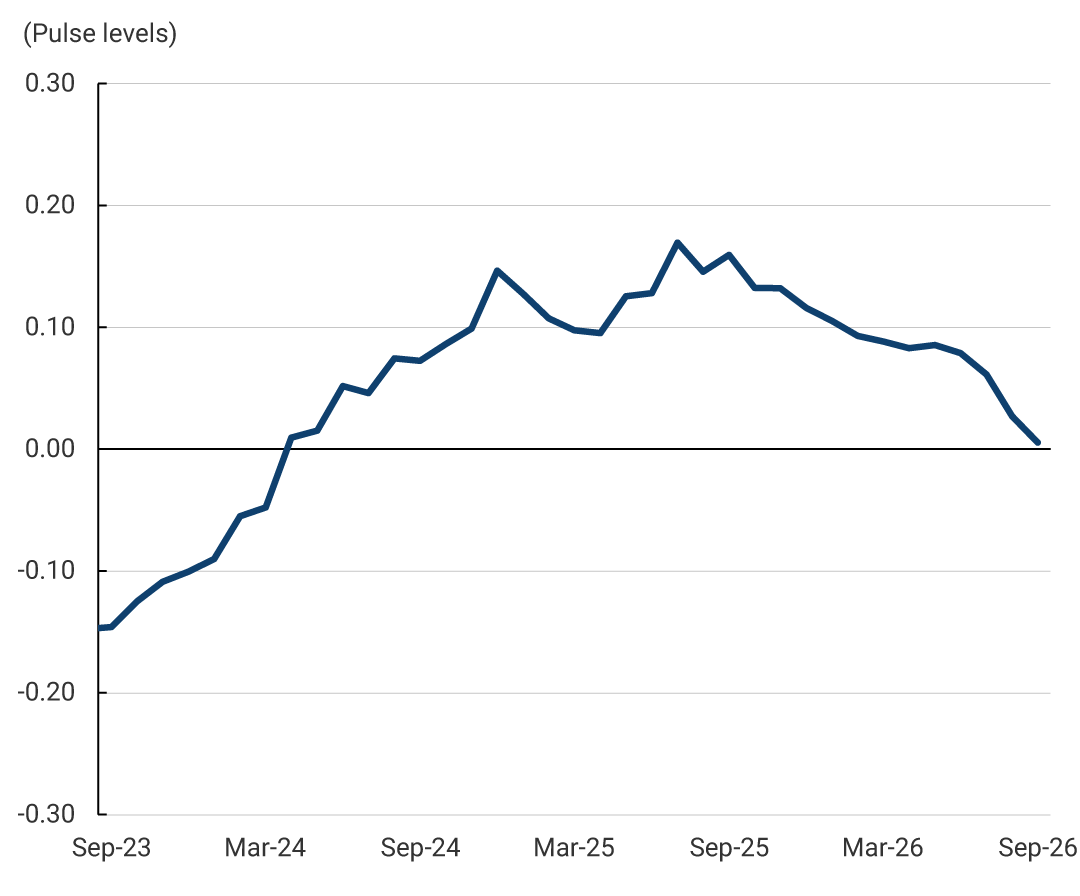
According to the Regional Economic Pulse (PER, by its Spanish acronym) indicator, the national economy would have continued the slowdown observed so far in 2026, recording a year-on-year growth close to zero in the third quarter of 2026 (Graph 1). The slowdown would have been widespread across all regions, although Bogotá and the Northeast remained in positive territory. The effects of the 10 August earthquake and the impact of high temperatures on agricultural output likely accounted for most of the slowdown in economic growth.
Rolling Quarter Average
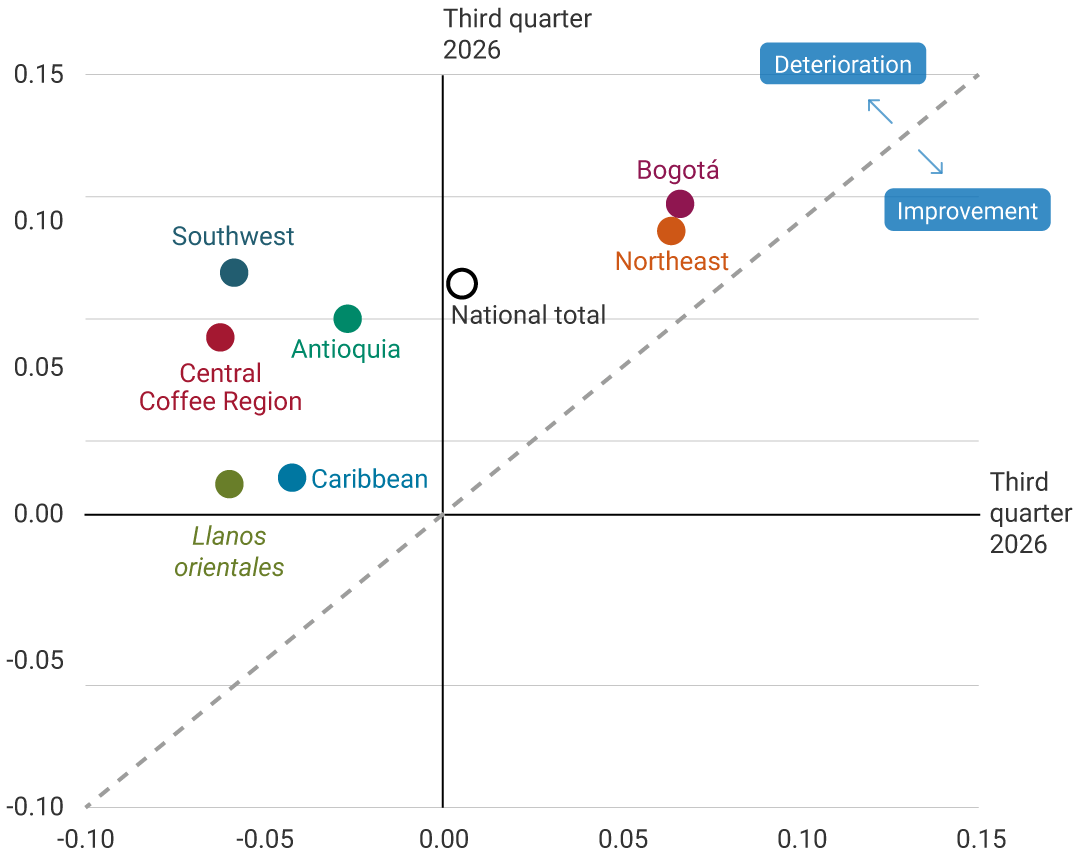
Economic activity likely declined year-on-year in five of the seven regions, and all regions likely performed less favorably than in the previous quarter (Graph 2). The most notable deteriorations likely occurred in the Southwest and Central Coffee regions, the areas most severely affected by the 10 August earthquake. In these regions, the impact on industry and new housing sales likely led to a sharp decline in economic activity amid weaker demand, infrastructure damage, and more cautious spending behavior. These effects were compounded by high temperatures and wildfires, which affected the agricultural and livestock sector. Although less exposed to the earthquake, Antioquia, the Caribbean region, Llanos Orientales also likely experienced declines associated with the adverse effects of high temperatures and lower water availability on the agricultural and livestock sector, as well as a decline in new housing sales. In Antioquia, the Caribbean region, the Central Coffee region, and the Southwest, the hospitality sector would have contributed to the negative performance amid an exchange rate that was less favorable to international tourists, security concerns, and the effects of the earthquake in the hardest-hit areas. Additionally, in Llanos Orientales, lower rice supplies to the food industry would also have negatively affected manufacturing output. By contrast, Bogotá and the Northeast would have maintained positive annual variations, partly driven by the positive performance of industry and transportation. In the country’s capital, commercial activity would also have contributed positively to the region’s economic performance, driven in part by donations made to support the regions affected by the earthquake.
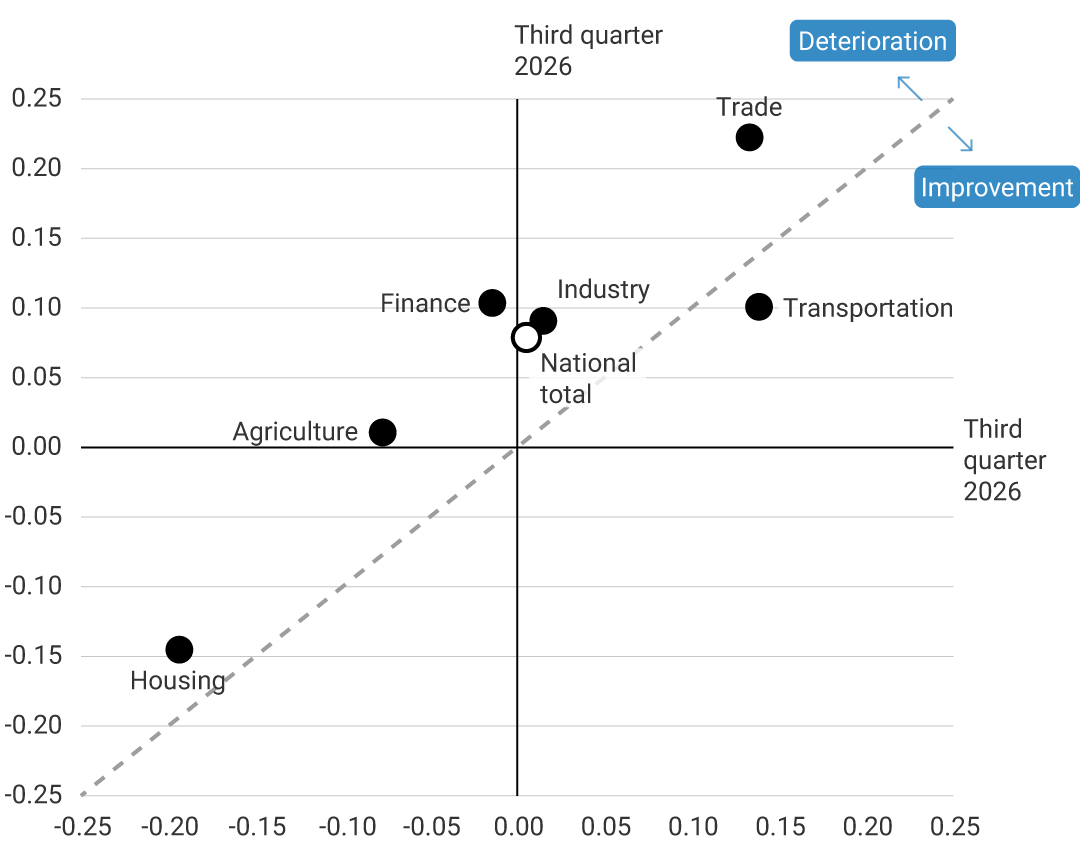
By sector, transportation, trade, and industry would have expanded, although the latter two would have grown at a slower pace than in the previous quarter (Graph 3). According to the PER surveys, activity in the trade sector likely remained constrained by household spending caution and the effects of the earthquake, despite sustained growth in vehicle and motorcycle sales. Industry likely faced weak demand, high costs, and damage caused by the earthquake. However, the food processing and transportation equipment manufacturing would have expanded in response to stronger demand. Transportation would have grown at a faster pace, driven by an increase in road and air cargo transportation, despite a decline in urban passenger transportation associated with restrictions and isolated cancellations following the earthquake. By contrast, financial, housing, and agricultural and livestock activities likely contracted. According to the sources consulted, credit disbursements would have declined due to households’ and firms’ lower willingness to borrow, as well as tighter credit conditions. New housing sales likely declined due to higher financing costs, reduced availability of subsidies, and uncertainty, as well as fewer completed sales and the temporary suspension of construction projects related to the earthquake. Finally, the agricultural sector likely contracted due to adverse weather conditions and higher costs, which discouraged some previously planned planting, although growth in some livestock products partially offset this result.
Archive of the Regional Economic Pulse (available since 2025)
The Regional Economic Pulse indicators and their report are constructed based on surveys to businesspeople and executives who are asked about their perception of the dynamics of their economic activity in the annual comparison and on available statistical information. It is prepared by the Regional Economies Section of the Technical and Economic Information Department of Banco de la República (the Central Bank of Colombia).