Current Situation of the Colombian Economy - Report By the Governor of the Central Bank of Colombia
| EXECUTIVE SUMMARY | |
| Since mid 2014, Colombia has had to adjust to several adverse events of diverse nature and magnitude, which arose on both the external and domestic fronts. Fortunately, the Colombian economy has responded better than other countries in the region. The orderly adjustment to face with these shocks has been possible largely thanks to appropriate economic policy responses, both monetary and fiscal; to the robustness of the financial system; and to the existence of other natural stabilization mechanisms of the economy such as the flexibility of the exchange rate. There have been three external shocks: the first, and perhaps the one with greatest impact due to its magnitude and permanent nature, has been the sharp fall of the international prices of the main commodities exported by the country since mid 2014, particularly oil, negatively affecting the terms of trade. It must be noted that oil prices will remain low, which implies a permanent change in the structure of the economy. The second has been the slowdown in the economies of the country’s major trading partners. The third one is related to greater external financing costs due to the increased risk premia for the country and the depreciation of the currency, which have taken place as a result of the two previous events. Added to these extreme events, others of domestic origin took place at the end of 2015 and in 2016. These domestic shocks, although transitory in nature, deepened the deterioration of the country's main macroeconomic variables: in the first place, the climatic effect of a severe El Niño phenomenon observed since mid 2015 and, secondly, the trucking strike, which affected a large part of the country in June and July of 2016. The combined effect of these events led to the emergence of macroeconomic imbalances to which the economy has had to adjust. The oil shock implied a significant deterioration in the country's terms of trade, leading to a widening of the current account imbalance and, at the same time, to deterioration of public finances, given the strong dependence of the country on oil revenues. The lower income from exports, along with increases in the country's risk premia, generated a significant depreciation of the peso, which, together with domestic supply shocks and the activation of indexation mechanisms, led to an increase in inflation, causing it to post outside the target range set by the Central Bank (between 2.0% and 4.0%). The deterioration of national income and the adjustments to government spending (given the lower oil revenues) as well as the response of the economy to monetary and fiscal policy actions, led to a weakening of domestic demand, which, linked to a fragile external demand, explains the slowdown of economic growth in the past two years. Thus, the high levels of inflation were accompanied by a significant slowdown in growth. This situation posed a strong dilemma to the authorities and for the monetary policy response. In the beginning, in order to enable convergence of inflation back to the Central Bank's target and to keep inflation expectations under control, the Board of Directors of Banco de la República (BDBR) began an upward cycle of the benchmark interest rate, taking it from 4.5% in September 2015 to 7.75% in July 2016. In order not to stifle economic growth, these actions were moderate, but they implied not achieving the inflation target in 2015 and 2016. Ending last year, inflation began to recede, and, inasmuch as different economic activity indicators suggest that the slowdown could be greater then expected, the Board started a downward cycle of the benchmark interest rate, placing it at 6.5% at its meeting last April. Hence, the monetary policy response has had to adapt to the new conditions of the economy, simultaneously facing high inflation and slowdown of the economic activity. Toward the end of this year, inflationary pressures are expected to have faded, and that once again inflation approaches the 2.0% to 4.0% target range, headed towards its long-term 3.0% goal. In this scenario, the monetary policy will be able to support growth more strongly in order to lead it to its potential. However, in order for the economy to grow at satisfactory rates, much more is needed than lowering the interest rates. Achieving this goal will require structural reforms that do not depend on the Central Bank, but on the government, businesses, and society in general. |
| I. The Impact to the Terms of Trade and the Adjustment of the Economy |  |
|
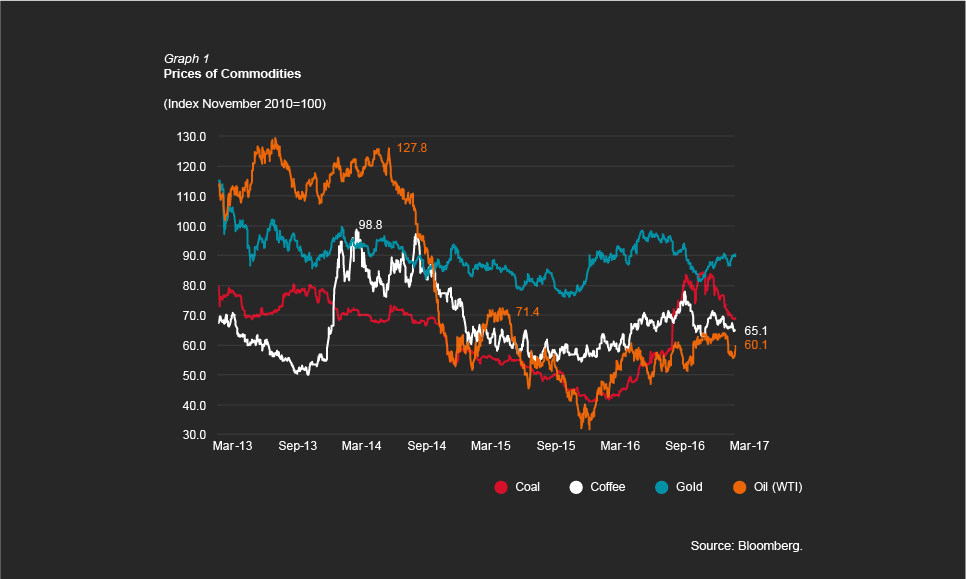
The fall in the terms of trade faced by Colombia since the second half of 2014 and that deepened in 2015 originated mainly in the surprising, strong fall of the international price of oil. The decline between the third quarter of 2014 and the first quarter of 2016 was close to 70%, at which time prices began to rise vis-à-vis the lower levels of global production1. The price for WTI oil stepped down from USD 97,6 per barrel in 2013 to USD 44,5 per barrel in 2016, on average. So far in 2017, this price has posted around USD 52 per barrel, on average. The prices of other products exported by Colombia also recorded declines, although not of the same magnitude as oil (Graph 1). |
1/ At the end of 2016, the OPEC member countries signed an agreement to reduce oil production. Also, another agreement with non-members was signed in this sense. |
|
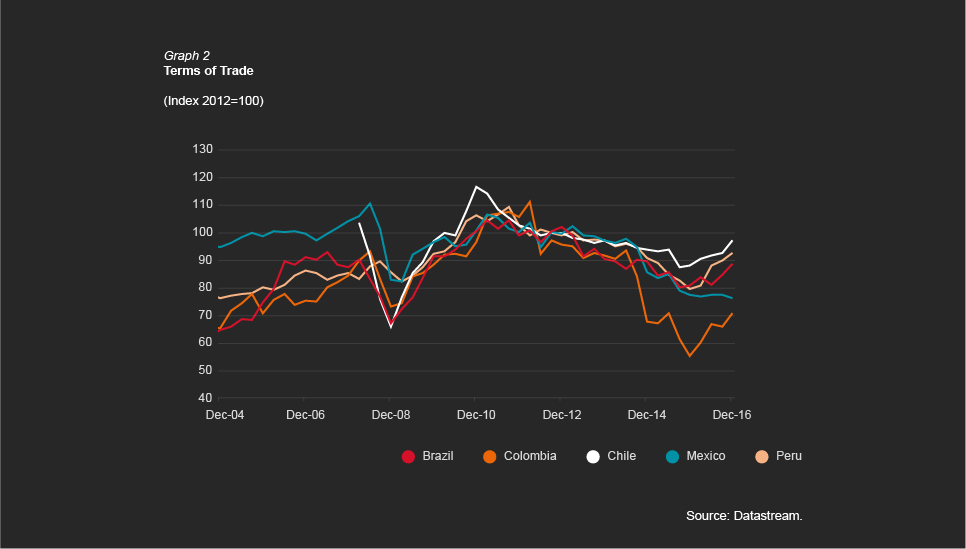
The terms of trade fell nearly 46% between June of 2014 and early 2016 (Graph 2). The magnitude and permanent nature of the fall, as well as the importance that oil came to have in the Colombian economy2 in previous years, generated a great impact on national income, and were responsible for the appearance of major macroeconomic imbalances. As a result of lower export prices and their effect on quantities, the value of the country's total exports fell 47% in 2016 compared to the average value recorded in the year prior to the shock (2013). This led to a significant deterioration in the country's current account of the balance of payments, whose deficit moved from 3.2% of GDP in 2013 to 6.4% in 20153, despite the sharp reduction of outflows by factor income of the companies with foreign capital4, mainly in the oil sector.
|
2/ In 2013, oil represented 55% of the total value exported, 30% of foreign direct investment, and 19.6% of the National Government’s income. 3/ In US dollars, the current account deficit moved from USD 12,449 million in 2013 to USD 18,922 million in 2015. The greater increase as a proportion of GDP is explained largely by the effect of nominal depreciation of the peso on the GDP in US dollars. 4/ Outflows in US dollars by factor income decreased from USD 16,637 million in 2014 to USD 10,009 million in 2015. |
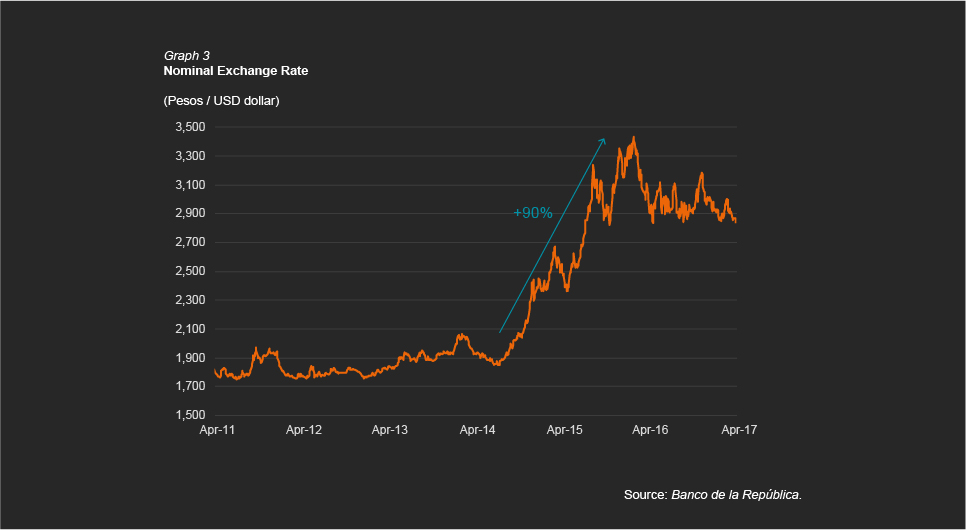
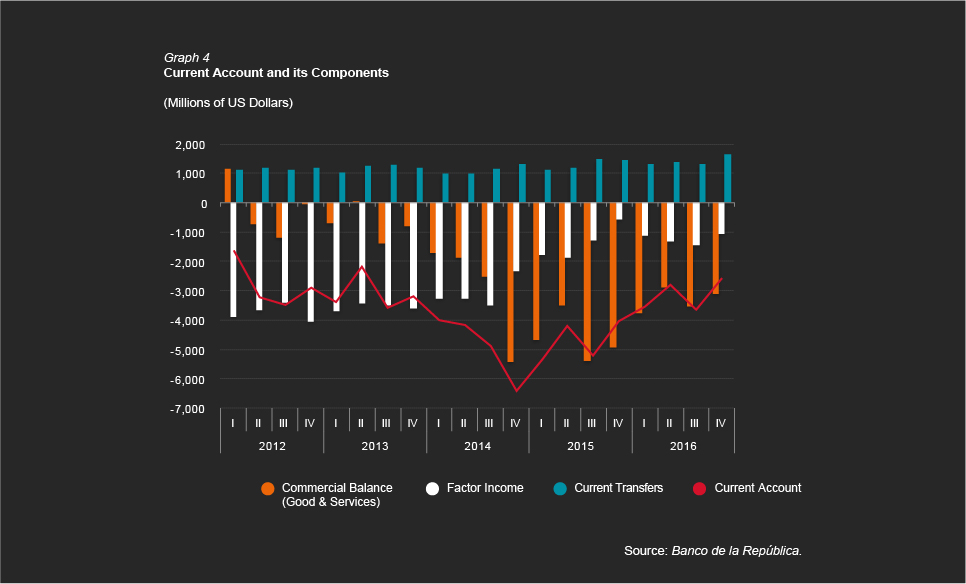
| Lower external revenues (both from exports as from lower foreign direct investment5) along with the increases in the country's risk premia generated a strong nominal devaluation of the peso. The exchange rate (the value of dollars expressed in pesos) increased by almost 90% between mid 2014 and February 20166, when it reached a maximum level above 3,400 pesos per US dollar (Graph 3). The strong accumulated depreciation of the peso and lower growth in the economy led to a marked reduction in imports, thus becoming the main factor for the lowering of the current account deficit, moving from 6.4% of GDP in 2015 (USD 18,922 million) to 4.4% (USD 12,541 million) in 2016 (Graph 4). |
5/ Foreign direct investment fell by 27% between 2014 and 2015, moving from USD 16,163 million to USD 11,732 million, mainly by the smaller investment in the oil sector. 6/ This figure is obtained when the maximum and the minimum daily levels registered during this period are compared. |
| Oil revenues accounted for about 20% of the National Government's total income in 2013 (3.3% of GDP), 6.9% (1.1% of GDP) in 2015, and virtually disappeared in 20167. Partly for this reason, the fiscal deficit moved from 2.4% of GDP in 2014 to 4.0% in 2016, in spite of the adjustment in current expenditure and investment, and of the increase of certain taxes8 proposed by the Government and processed by the Congress. The larger deficit and the high interest payments generated by the depreciation increased the Central Government's debt from 35% of GDP in 2013 to 44% in 2016. The external and fiscal adjustments, as well as the loss of dynamism of national income, resulted in a deterioration of domestic demand, which along with a weak external demand led to a slowdown in growth that went from 4.4% in 2014 to 2.0% in 2016. Particularly, lower household income, adjustment of public expenditure, higher financing costs, real depreciation, and the fall in consumer confidence explain the weakening of domestic consumption. Similarly, investment was affected by the reduction in oil and mining projects, by the adjustment of public investment, and by lower imports of capital goods due to the depreciation of the peso. |
7/ In 2016, the value of oil income was negative (-0.6%), basically due to tax return. 8/ At the end of 2014, the Government filed a mini-tax reform, which created a temporary tax on wealth and increased the fees of the CREE (impuesto sobre la Renta para la Equidad), among others. Additionally, in 2016, the Government made a cut in investment of one percentage point of GDP. |
| II. Performance of the Colombian Economy in 2016 and so far in 2017 | |
| Amidst this context, the adjustment process continued during 2016 in a relatively orderly manner and according to the forecasts. The macroeconomic imbalances, which reflected on the devaluation of the peso, deterioration of national income, weakening of economic activity, and the increase in inflation continued throughout the year, but some of them began to show signs of improvement in the second half of the year. For 2017, the adjustment process is expected to continue, particularly in the non-tradable and tradable sectors different from oil. Once this process is completed, the economy is expected to return to its potential growth path, and inflation is expected to converge to the long-term target set by Banco de la República. A. Inflation Annual consumer inflation recorded a steady acceleration in the past two years, but began to decrease as of August 2016. Inflationary pressures (all of them transitory) generated by the accumulated depreciation, the El Niño phenomenon, and the trucking strike in mid 2016, strongly affected prices since the end of 2014 and led inflation to increase from 3.66% that year to 6.77% at the end of 2015, reaching a maximum level9 of 9.0% in July 2016. Since the second half of 2016, a marked downward trend of inflation began to be observed, attributable both to the dissolution of the impact of the transitory shocks mentioned before and to the effects of the Central Bank's contractionary monetary policy (which started in September 2015 and extended along 2016). Thus, total annual inflation in December 2016 stood at 5.75%, and had fallen to 4.7% in March 2017. Non-food inflation, on the other hand, reached levels close to 6.3% on a yearly basis by mid 2016 and ended the year at levels close to those of headline inflation (5.14%). In March of this year, it was 5.13% (Graph 5). |
9/ The highest in the past 16 years. |

| The main source of inflationary pressures was the El Niño phenomenon, one of the most severe in the last fifty years, which began in the second half of 2015 and extended well into the first part of 2016. Its effects on the supply of agricultural products and food prices, especially on perishables (which are very sensitive to weather conditions), were considerable. Added to this was the trucking strike in the middle of the year, which had a transitory impact on supply and on food prices. Thus, the annual variation in food prices went from 4.7% in December 2014 to 10.9% at the end of 2015, reaching a peak of 15.7% in July 2016. The shocks were transitory, and pressures finally began to subside, with food price increases of 7.22% at the end of 2016 and 3.65% in March this year (Graph 6). |

| The depreciation of the peso, which began in the second half of 2014 and continued until the first quarter of 2016, was another source of high inflation. It not only affected the prices of tradable goods directly, but also passed-through to the prices of non-tradable and regulated items via higher costs of inputs and imported raw materials. As for tradable goods (excluding food and regulated items), inflation reached a peak of 7.9% last June after having posted at 7.1% at the end of 2015 and 2.0% in 2014. In the second half of 2016, it fell, reaching 5.3% in December, reflecting a greater stability in the exchange rate and more moderate adjustments in prices. Unfortunately, the aforementioned transitory shocks have generated persistent effects on inflation, activating various indexation mechanisms, which reflected on salary adjustments and increases in inflation expectations, among others. Thus, second-round effects have been generated on the prices of other products and services such as health, education, and leases (Graphs 7A and B). |


|
To March 2017, the declining trend in inflation has continued, mainly explained by the lower increases in food prices (5.97% in January, 5.21% in February, and 3.65% in March). In particular, the falls observed these months in the prices of perishable foods (close to 10%) are a clear signal that the effects of the previous climate shock are disappearing. On the other hand, although the accumulated depreciation of the exchange rate has also ceased to have any impact, the annual variation in prices for tradable goods, which had decreased considerably by the end of last year, has shown slight increases so far this year. This might be related to the impact of the tax reform and to the entry into force of the Liquor Act. Once more, these are transitory shocks whose effects may possibly disappear at the beginning of 2018. |


| Investment grew 11.6% in 2014 and 1.2% in 2015, but contracted 4.5% in 2016. Among the main items that exhibited deterioration are investment in machinery and equipment and in transport equipment, partly due to the lower profitability of the oil and mining sectors, the accumulated depreciation, and higher financing costs. The decline of these investments was slightly offset by increased investment in construction, stimulated by several National Government programs intended to encourage social housing construction and by increased spending on infrastructure by local and regional governments. The rate of growth of consumption fell to 2.0% in 2016 from 4.4% in 2014, due to moderation in both household and government spending (Graph 9). The lower growth in private consumption (2.0%) resulted from the loss in the purchasing power of real income. The depreciation of the peso, on the other hand, discouraged the purchase of imported products. The low growth in public consumption (1.8%) was mainly due to the adjustment of Government expenditure as a response to the fall in oil revenues. |

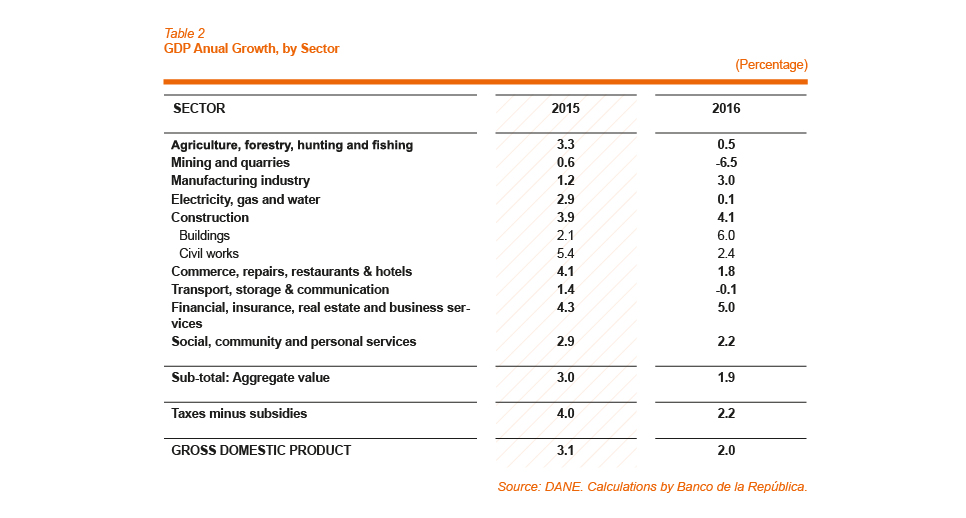
| On the side of external demand, in 2016, exports fell 0.9% in real terms, as a result of the lower oil production and the weak demand by the country's trading partners. In the year, crude oil production was of 885.7 thousand barrels per day, falling 11.1%. This was offset by the 6.2% contraction in imports in real terms, which allowed for a positive contribution of the trade balance to GDP growth. Analyzing the behavior of the different sectors (except for the good performance of financial services, construction, and industry, which grew 5.0%, 4.1%, and 3.0%, respectively), other branches of activity exhibited a general slowdown, which recorded a lower expansion in 2016 than the average for the last ten years (Table 2). Production of tradable sectors showed stagnation vis-à-vis the 1.4% growth in the previous year, mainly as a result of lesser mining activity. On the other hand, non-tradable activities slowed down from 4.1% in 2015 to 3.2% in 2016 (Graph 10). |

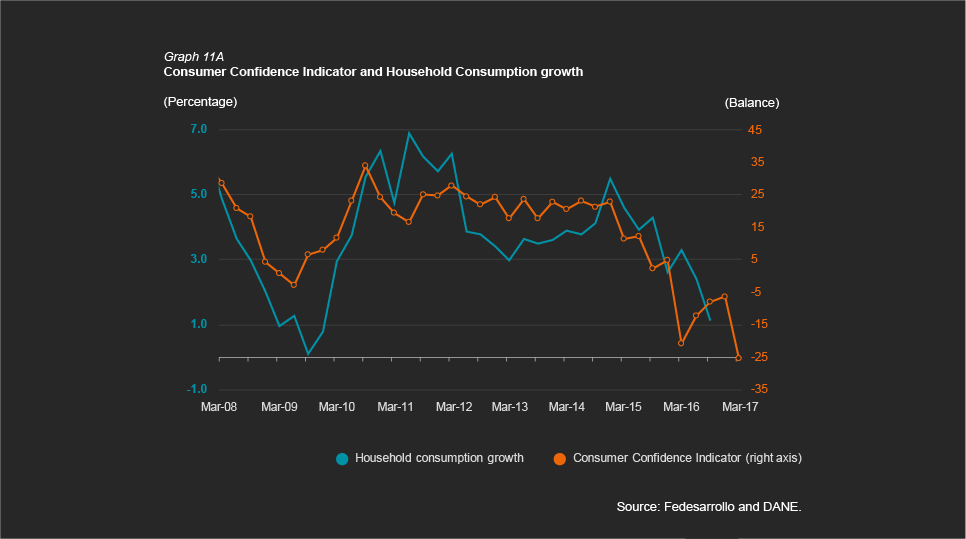
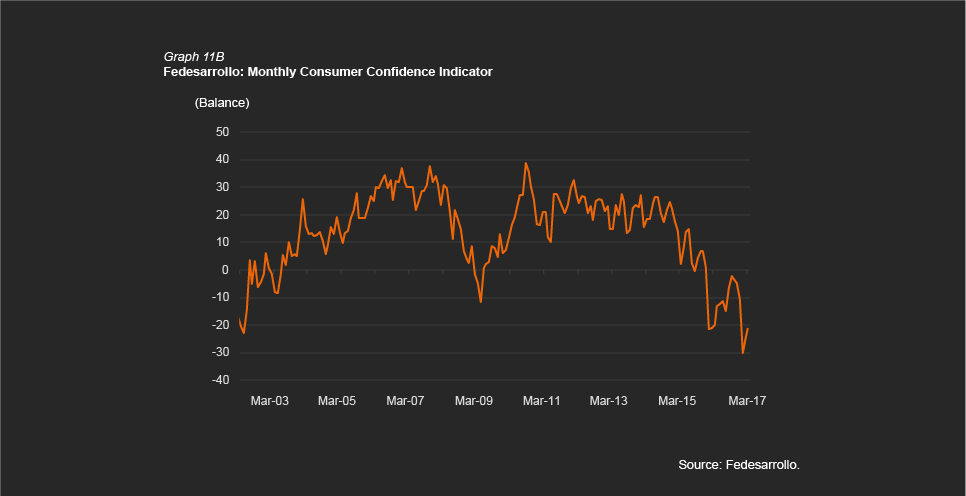
| So far this year, recent indicators of economic activity such as retail sales, industrial production, and consumer confidence suggest that the economy has continued to weaken (Graph 11). Particularly, the low levels of household confidence observed could affect consumption plans for the rest of the year. The unemployment rate has exhibited slight variations since mid 2016. |
| C. The External Sector and Trade The lesser dynamics of national income and the slowdown in economic activity implied a significant reduction of the current account deficit during 2016 as a result of the greater fall in current outflows than that of income flows. The high share of imports and exports of goods within the country's total current expenditures and revenues implies that the dynamics of the current account was relatively similar to that of the trade balance. Consequently, in 2016, the 28% reduction of the trade deficit in goods and services (USD 5,225 million), explained close to 85% of the decline of the current deficit (USD 6,239 million). This result was due to the 17% annual fall of imports of goods, which stepped from USD 52,050 million in 2015 to USD 43,226 million, as a response to reduced domestic demand and to the real depreciation of the peso. Such behavior was widespread, with the fall in external purchases of inputs and capital goods for industry and those of transport equipment standing out. Exports of goods fell 13.4% (USD 5,115 million) in 2016, due primarily to lower external oil sales by USD 4,774 million, considering both the fall in the volume dispatched and, mainly, the lower price for oil exports. Exports of industrial goods also exhibited a reduction, although smaller (USD 880 million) (Graph 12). |

| During 2016, net capital inflows reached USD 12,764 million, i.e., USD 5,529 less than observed the previous year. These revenues are explained largely by the USD 13,593 million from foreign direct investment (56% of the total external revenue), and to a lesser extent by portfolio investment in the local market (24% of the total). These inflows of foreign capital to the country show that, despite the macro-economic adjustment, Colombia continues to exhibit an imbalance between savings and investment. This makes it necessary to resort to external savings in order to finance the expenditure needs of the economy. D. Monetary Policy, Interest Rates, and Credit Between September 2015 and mid 2016, the Central Bank increased the benchmark interest rate by 325 basis points in order to control inflation and prevent inflation expectations from deanchoring10. These increases were transmitted more intensely to commercial credit rates, and to a lower extent, to those of household credit. As the inflationary outlook began to recede, and considering the risk balance between expected growth and inflation expectations, the Board of Directors started to lower the policy rate, and decided to lower it by 25 bp in each of its meetings in December 2016 and February and March 2017, and 50 bp in its last meeting, placing it at its current 6.5% level (Graph 13). As convergence of inflation to the target set by the Central Bank continues, inasmuch as the economic data allows for it, the Board will define the pace for the reduction of the benchmark interest rate. |
10/ Although inflation expectations increased, they never reached the high level of inflation, which reflects the credibility of the agents of the economy in the Central Bank’s policy. |

| In this context, the level of indebtedness11 of the agents of the Colombian economy (as a percentage of GDP) tended to stabilize in 2016 at the historically high levels reached in the previous year (62%). Indebtedness registered a modest growth of around 1.0% in real terms as a result of the slowdown of the corporate loan portfolio as well as of the faster growth pace for the household loan portfolio. Throughout the year, deterioration of the portfolio's quality indicators12 was observed above the average for the last five years, given the slower growth rate of the total portfolio and the increase of non-performing and risk loan portfolios13. However, in spite of the recent acceleration of the non-performing portfolio, the quality indicators remain low and manageable14. This, together with liquidity and solvency indicators at good levels, attests to the solidity of the Colombian financial system. E. Fiscal Policy Faced with the prospect of further deterioration of public finances, the risk of non compliance with the fiscal rule, and the need to ensure sustainability of public debt in the medium-term, the tax reform was adopted at the end of last year. With this reform, the Government expects to gradually increase its tax collection from a 0.7% of GDP in 2017 to 3.1% in 2022. The additional revenues originate mainly in the increase of the general VAT from 16% to 19%, the creation of the taxation of dividends, and the establishment of the financial transactions tax as permanent. The higher expected income and a slight adjustment to the operating and investment costs would involve a reduction of the fiscal deficit, reaching 3.3% of GDP in 2017. Due to the expected impacts, the probability for Colombia to comply with the fiscal rule today and in the future has increased, which is one of the fundamental reasons why risk-rating agencies have improved the outlook for the country. In the future, the fiscal imbalance will continue being a significant aspect of macroeconomic stabilization. Therefore, this front cannot be left unattended, and it is necessary to design long-run structural reforms that allow for a sustainable growth path higher than the current one. |
11/ Indebtedness includes banking credits in domestic and foreign currency, placement of bonds in the domestic and foreign markets, and direct external financing. It does not include that from the National Government. |
| III. Prospects for 2017 | |
| In 2017, the Colombian economy is expected to continue adjusting to the lower levels in the terms of trade in such a way that the fiscal, external, and relative price adjustments, together with policy measures, allow for macroeconomic imbalances to disappear during the year. This adjustment could be alleviated by: better expected external and domestic conditions, given the improvement in developed and emerging economies; the relative recovery of the prices of commodities, mainly oil; the better performance of some of the country’s trading partners; and the fading effects of El Niño and accumulated depreciation of the peso on inflation. For this year, the Central Bank’s technical staff forecasts a growth figure slightly below to that observed in 2016 (1.8%). This estimate differs slightly from the figures by the Government and other analysts, such as Fedesarrollo and Anif, who expect a higher growth rate, close to 2.5%. Among the factors that could cause the economy to grow less is the uncertainty regarding the policies of the new government of the United States, the normalization of monetary policy in that country (which would be reflected in an increase in interest rates), and the unclear scenario of our major trading partners in the region, particularly Ecuador and Venezuela. Locally, the pace of recovery of the main economic activities as a response to external and internal factors is uncertain. However, should expenditure on fourth-generation infrastructure projects (4G) and government housing programs consolidate, public investment could be one of the sources driving growth this year. Additionally, tax benefits to the companies included in the reform could have effects on private investment, but this effect would be more likely to be seen in the medium and long terms. Finally —and this could be a determining factor— Banco de la República began lowering its benchmark intervention rate a few months ago, and will continue to do so as long as inflationary pressures recede. Consumer inflation is expected to continue converging toward the Central Bank's 3.0% target during 2017 and 2018, once the effects of the transitory supply shocks fade, inflation expectations become anchored once more, and the indexation of some prices reduces. Inflation expectations for 2017 and 2018 reported by financial analysts corrected the upward trend displayed throughout 2016, approaching the upper limit of the target range (2.0%-4.0%). (Graph 14). The different surveys report average expectations ranging between 4.26% and 4.58% to December 2017, and between 3.43% and 3.86% to December 2018. |


| The inflation expected by the financial markets is even lower, even though its calculation is not free from difficulties. As shown in Graph 15, the inflation figures expected for 2017 and 2018 declined in the February-April period. Inflation levels close to 3.2% by the end of 2017, and to 3.1% by the end of 2018, are expected. |


