Quarterly Update of the Financial Stability Report – September 2024
The main purpose of these documents is to provide semiannual information on the vulnerabilities and risks of the financial system. The views presented and potential errors are the sole responsibility of the authors and their contents do not compromise the Board of Directors of Banco de la República
This document provides an update on the main risks faced by the local financial system. It assesses the quarterly evolution of vulnerabilities identified in the Financial Stability Report for the first half of 2024: i) sudden changes in global financial conditions; ii) materialization of credit risk; and iii) deterioration in the performance of financial institutions. Additionally, this update seeks to inform financial market participants and the public about the main risk mitigants and to present the in-depth analyses that will be featured in the Special Reports on Financial Stability (only in Spanish)1 and the Financial Stability Report for the second half of 2024.
1. First vulnerability: Sudden changes in global financial conditions
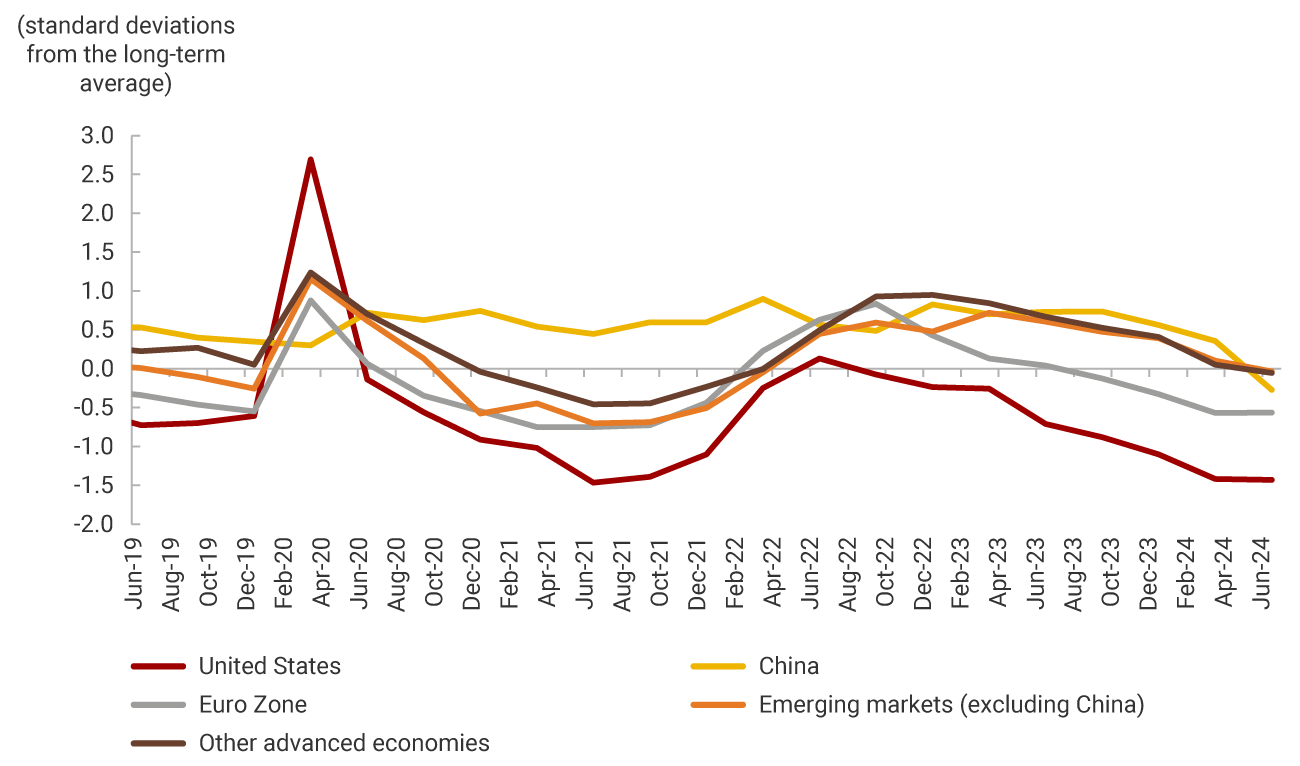
As of September 2024, the likelihood of a reduction in the U.S. Federal Reserve policy rate has increased, raising the possibility that external financial conditions may loosen by the end of 2024.
This loosening, which has been generalized for the main advanced and emerging economies (Graph 1), has occurred amid adverse economic outcomes, negatively affecting market volatility and risk appetite. This could diminish the positive effect of lower external funding rates. Conversely, escalating geopolitical conflicts could slow down the pace of interest rate declines in global markets and dampen global economic growth expectations. The interaction of the positive effect of lower expected rates and the negative effects of increased risk aversion has meant that this risk has remained unchanged over the last three months.
As of August 2024, there has been no evidence of negative impacts on market price volatility, sovereign risk perception, or the local exchange rate resulting from changes in external financial conditions.
However, volatility has been observed in public debt market traded volumes due to changes in the weightings of some international sovereign debt benchmark funds in which Colombian bonds have lost representativeness2. This has led to foreign investors outflows and subsequent recoveries in their holdings of treasury securities (TES: bonds issued by the Colombian Government), resulting in a slight change in their share in this portfolio (19.7% as of August 2024 compared to 20.5% three months earlier). In turn, pension and severance funds managers have consolidated as the main investors in this market (30.6% as of August), increasing their exposure to the market risk for these securities.
2. Second Vulnerability: Materialization of Credit Risk
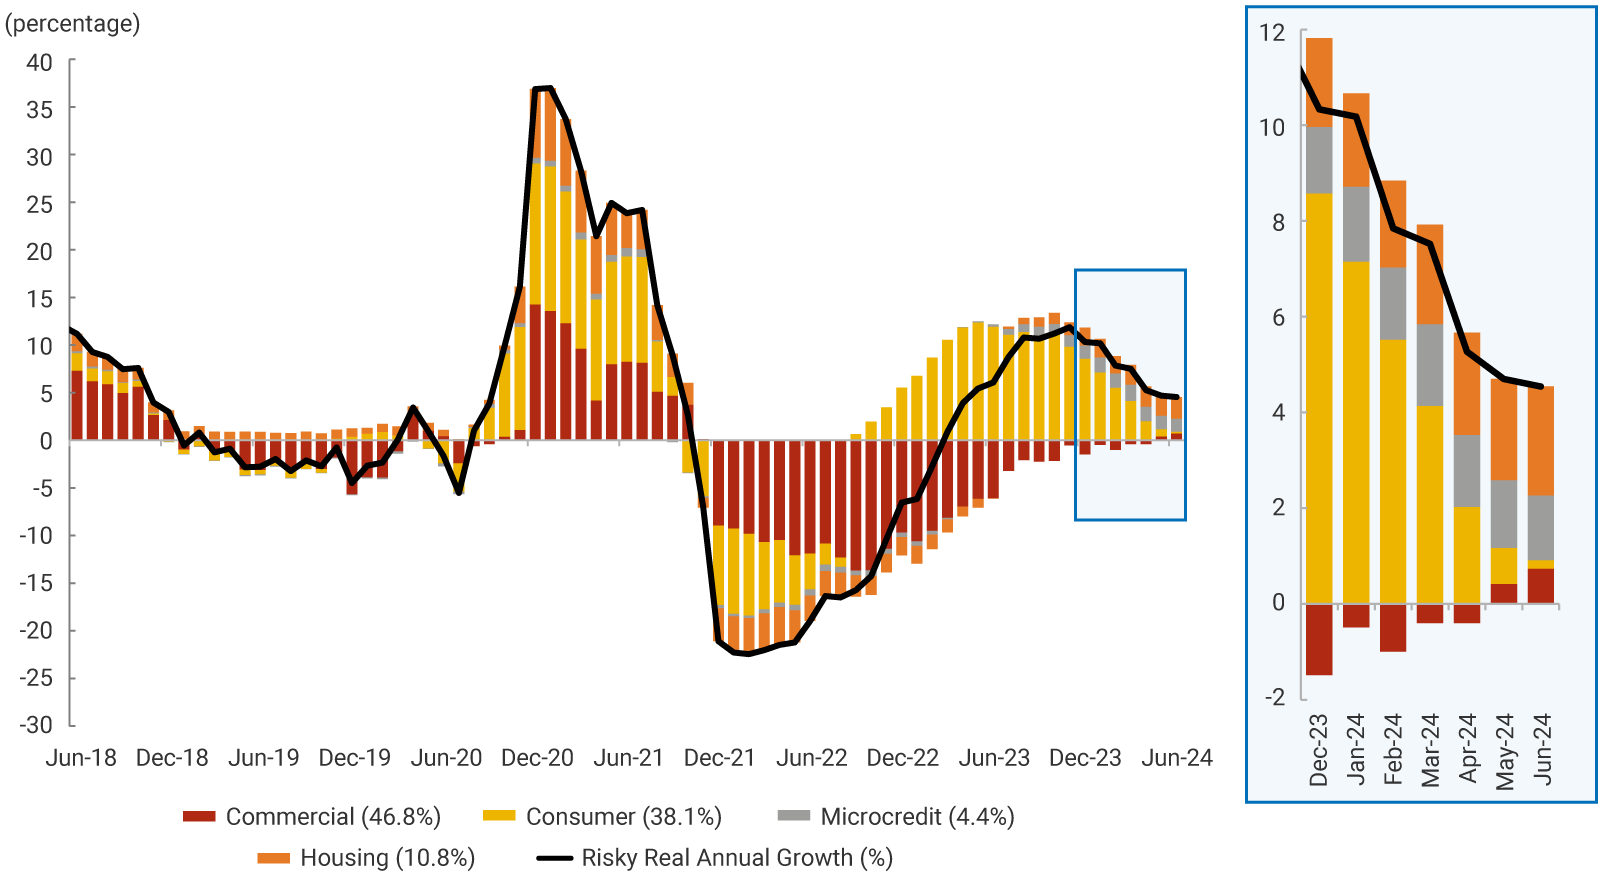
As anticipated in the latest Financial Stability Report, portfolio deterioration indicators for consumer and microcredit have improved, reversing the upward trend shown three months ago. Despite this improvement, they remain at high levels compared to the average of the last five years. Recently, a shift in risk towards housing and commercial loans has been observed.
The correction of non-performing loan (NPL) portfolio3 for consumer and microcredit has resulted in lower NPL indicators4 in the last quarter. In particular, for the former, the growth of the past-due portfolio began to register real contractions. Although delinquency levels remain high compared to its history, there has been a reversal of the upward trend in the NPLs of these portfolios at the beginning of 2024, along with lower delinquency for the recent consumer loan disbursements. When analyzing the growth of the risky loan portfolio5 it is observed that housing loans have significantly contributed to recent dynamics. Furthermore, commercial loans began contributing positively for the first time since the end of 2021 (Graph 2). This aligns with the analysis presented in the latest Financial Stability Report, which identified that the low activity levels in the housing market and the reduced investment in the economy could affect company growth. Further details of this analysis will be presented in the Special Report on Financial Stability: Analysis of the Real Estate Portfolio and Market in Colombia. Additionally, June 2024 Credit Situation Report, indicated that a significant percentage of intermediaries reported more restrictive lending conditions for these types of loans. This, together with the prospective dynamics of the risky loan portfolio, would suggest that credit institutions (CIs) have anticipated the likelihood of credit deterioration. The Special Report on Financial Stability: Credit Risk will analyze the determinants of delinquency in the recent past in detail.
As for households, there have been recent reductions in their debt-to-income ratio, continuing the downward trend observed since 2022.
Consistent with low growth in consumer and housing portfolios and in line with the expectations presented in the latest Financial Stability Report, household leverage indicators have continued their downward trend, reaching levels not seen since 2015. Despite this, the financial burden of households accessing new credit, defined as the percentage of disposable income allocated to the payment of financial obligations, remains slightly above its historical average. This dynamic and its main determinants will be detailed in the Special Report on Financial Stability: Households Financial Position.
3. Third Vulnerability: Impaired Performance of Financial Institutions
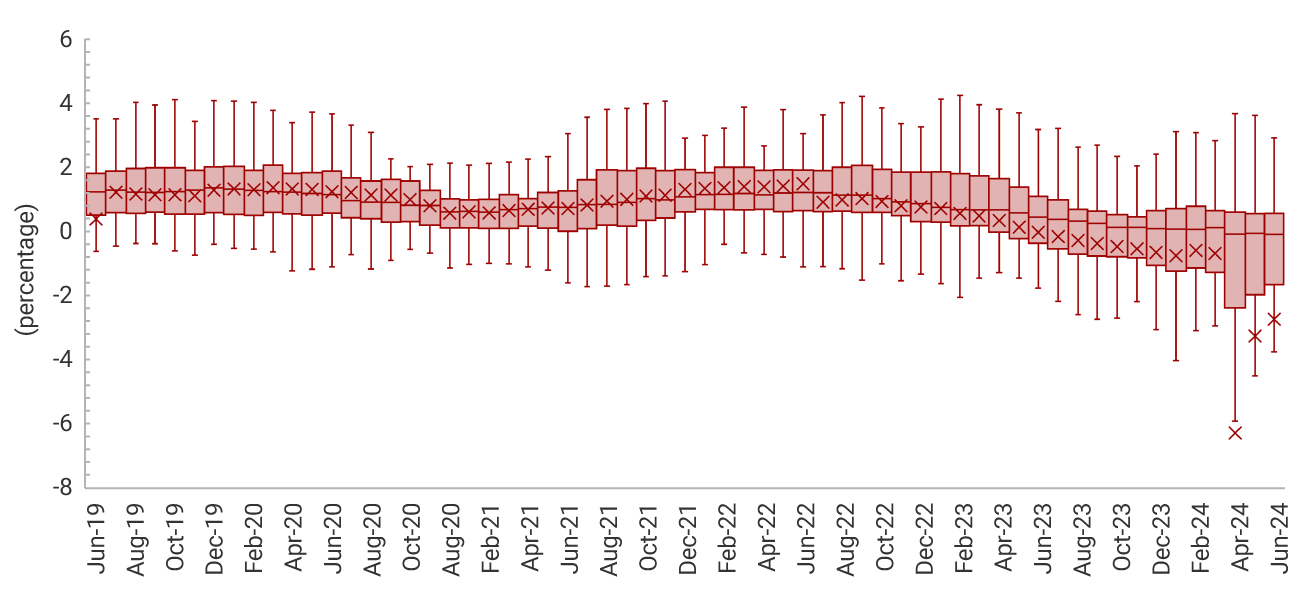
Regarding the financial health of credit institutions, a stabilization of the downward trend in profitability has been observed in the context of high levels of liquidity and capital.
Although the number of credit institutions exhibiting negative return on assets (ROA) remains high (Graph 3), the recent recovery of the net interest margin6 due to lower provisioning and funding costs has led to a stabilization of the aggregate indicator, which could signal future recoveries in these institutions’ profits. Credit institutions’ capital and liquidity indicators remain above the regulatory minimums, indicating no immediate threats to their soundness. However, recent changes in the methodology for calculating usury interest rates for some types of loans, along with legislative initiatives that could impact collection mechanisms and the information available from CIs to monitor credit risk, may pose risks to the recovery of these institutions’ profit. Non-bank financial institutions (NBFIs) continue to exhibit high levels of profitability comparable to those observed before the pandemic. Collective investment funds without permanence covenants (CIFs) have recorded increased liquidity, with indicators remaining above regulatory minimums. At a consolidated level, Colombian conglomerates with a presence in Central America have also shown improved prospects for profitability, liquidity, and solvency. Their operating environments and performance prospects will be analyzed in the Special Report on Financial Stability: Macroeconomic and Financial Situation in Central America.
Some credit institutions with low representativeness in the local banking system have adopted aggressive funding strategies consistent with medium-term expansion objectives.
The high deposit interest rates on demand deposits (e.g., savings accounts) offered by these institutions, together with lower funding needs in term deposits (e.g., CDs), have led to higher demand deposit shares in the liabilities of credit intermediaries. These dynamics could impact conditions of deposit competition in the market, a situation that will be analyzed in detail in the Special Report on Financial Stability: Concentration and Competition in the Deposit and Credit Markets.
In all, during the last quarter, there has been a favorable performance vis-a-vis the vulnerabilities identified in the Financial Stability Report for the first semester of 2024.
Particularly, credit risk has been less materialized, with prospects for improvement in the consumer and microcredit portfolios. This has resulted in improved intermediation margins and a stabilization in the profitability of institutions. As for external financial conditions, the financial system's exposure to this vulnerability has remained relatively stable.
In compliance with its Constitutional objectives and in coordination with the financial system’s safety network, Banco de la República will continue to monitor the outlook for financial stability closely and will make the decisions deemed necessary to guarantee the proper operation of the economy, facilitate sustainable flows of sufficient credit and liquidity resources, and promote the correct functioning of the payment system.
Table 1. Main Indicators of the Financial System
Note: Real growth was calculated using the non-food consumer price index (CPI).
| Indicators | March 2024 | June 2024 | 5-year average |
|---|---|---|---|
| Credit Establishments | |||
| Real asset growth | -5.98% | -3.68% | 3.29% |
| Real investment growth | -2.35% | 6.71% | 3.91% |
| Real growth of the total portfolio | -6.59% | -5.74% | 2.46% |
| Real growth of the commercial portfolio | -5.49% | -4.34% | 1.37% |
| Real growth of the consumer portfolio | -11.84% | -11.51% | 3.35% |
| Real growth of the housing portfolio | -0.61% | 0.45% | 4.93% |
| Real growth of the microcredit portfolio | 2.87% | 1.39% | 2.55% |
| Total portfolio NPL | 5.79% | 5.75% | 4.95% |
| Commercial portfolio NPL | 3.61% | 3.71% | 3.91% |
| Consumer portfolio NPL | 8.42% | 8.08% | 5.82% |
| Housing portfolio NPL | 7.09% | 7.43% | 6.33% |
| Microcredit portfolio NPL | 10.05% | 9.63% | 7.17% |
| ROA | 0.70% | 0.69% | 1.40% |
| Total Solvency | 17.57% | 17.64% | 18.14% |
| Basic Solvency | 14.49% | 14.64% | 14.00% |
| 30-day LRI | 208.37% | 194.63% | 204.27% |
| NSFR Group 1 | 113.51% | 114.80% | 110.03% |
| NSFR Group 2 | 117.24% | 119.90% | 114.93% |
| Non-Banking Financial Institutions | |||
| ROA - Stockbrokers | 4.50% | 5.57% | 4.57% |
| ROA - Pension Administrators | 12.21% | 13.63% | 12.13% |
| ROA - Trust Companies | 18.09% | 17.66% | 17.67% |
| ROA - General Insurance | 3.06% | 3.28% | 1.87% |
| ROA - Life Insurance | 2.60% | 2.70% | 2.46% |
| 30-day CIF LRI | 347.02% | 374.68% | 392.87% |
| FCIs portfolio value | COP 97.15 trillion | COP 95.70 trillion | COP 74.63 trillion |
| Household Debt | |||
| Financial burden of new credits - Banks | 34.70% | 38.83% | 36.87% |
| Debt to disposable income* | 32.09% | 31.90% | 35.87% |
* Due to availability of information, this indicator corresponds to Dec-23 and Mar-24.
1 ↑ These reports will be published at the end of September and the beginning of October 2024.
2 ↑ JJP Morgan confirmed India’s inclusion in the GBI-EM Global Diversified Index at the end of June 2024. The initial weighting will be increased to 10% in the index in March 2025. This has resulted in and will continue to result in a reduction in the weighting of Colombian bonds in the index. This would mainly affect the positions of those investors who are considered “indexed,” that is, those who follow the behavior of the index within their portfolio. The impact would be less noticeable for those investors who do not follow this benchmark index.
3 ↑ This is defined as a portfolio with an overdue payment of more than 30 days.
4 ↑ The NPL is defined as the ratio of the non-performing loan portfolio to the total portfolio.
5 ↑ This is defined as the portfolio with a rating other than “A.”
6 ↑ Net interest margin is defined as the difference between interest income and interest expenses.