Report on the Evolution of the Balance of Payments and International Investment Position - Second Quarter of 2024
The quarterly report on the performance of Colombia's balance of payments and international investment position outlines the main results for the country's current account and financial account, as well as the evolution of their items.
1. Overall Results for the Balance of Payments
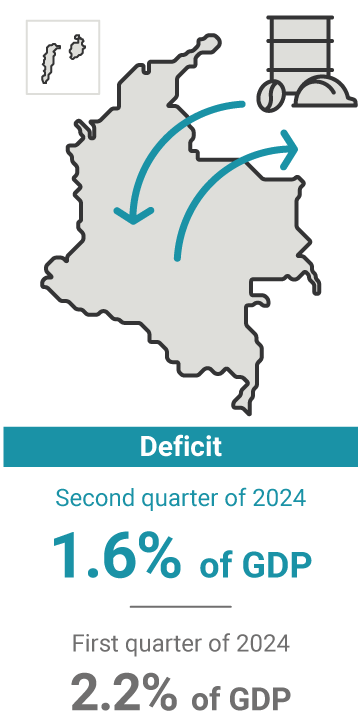
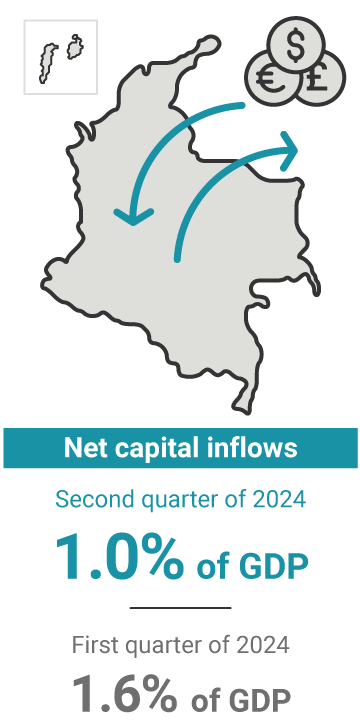
During the second quarter of 2024, Colombia’s current account of the balance of payments registered a deficit of USD 1,630 million (m), equivalent to 1.6% of the quarterly Gross Domestic Product (GDP). In turn, the financial account, including changes in reserve assets (USD 914 m), recorded net capital inflows of USD 1,084 m (1.0% of the quarterly GDP). Errors and omissions were estimated at USD 547 m.
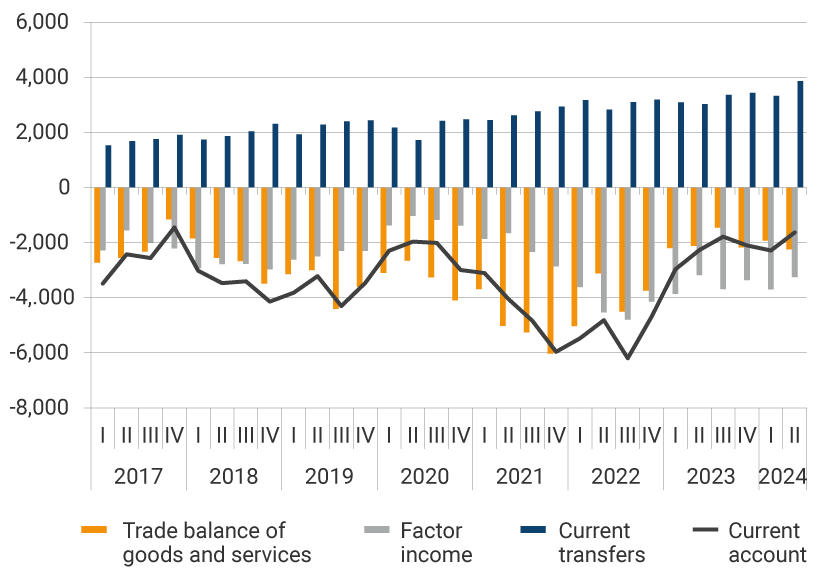
By components, the current account deficit (USD 1,630 m) in the second quarter of 2024 was due to net factor income outflows amounting to USD 3,252 m and deficit balances in foreign trade of goods of USD 1,967 m and services of USD 281 m. These results were partially offset by net income from current transfers of USD 3,869 m (Graph 1).
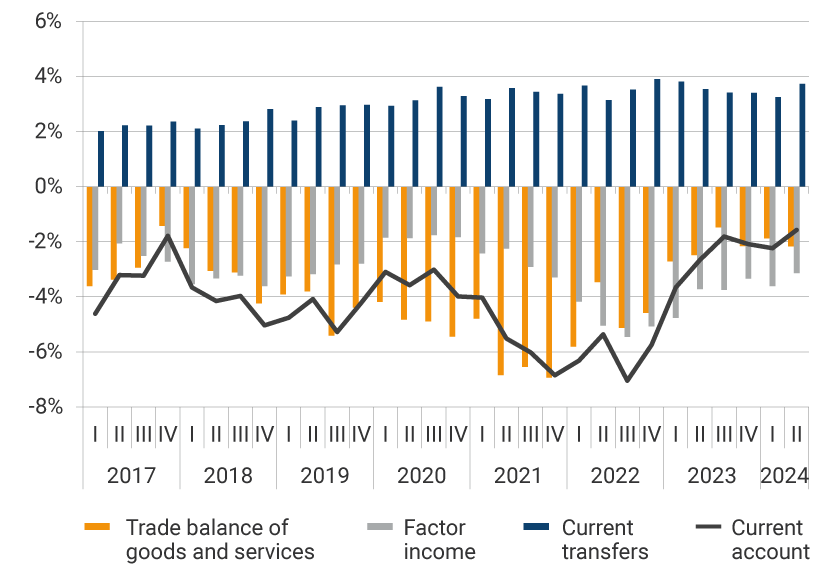
Graph 1. Components of Colombia’s Current Account of the Balance of Payments
Figures in millions of US dollars
Figures in millions of US dollars
Source: Banco de la República (the Central Bank of Colombia)
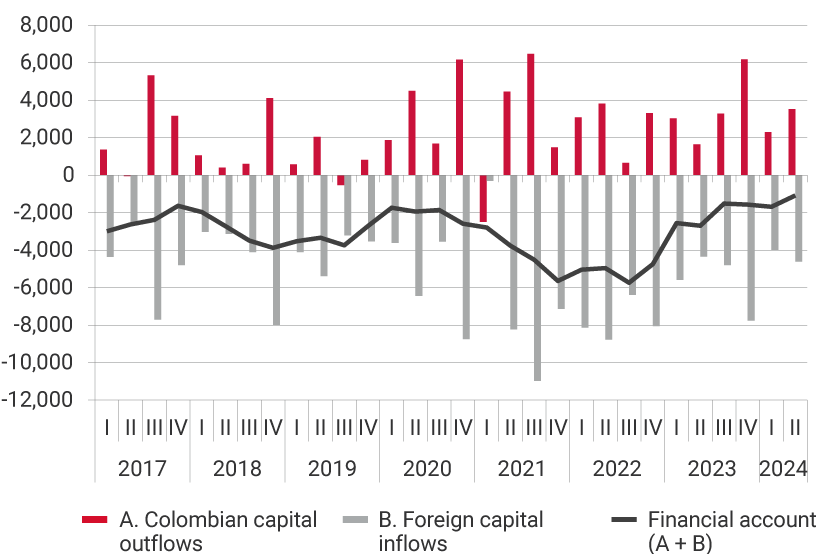
In the financial account for the second quarter of 2024, net capital inflows are estimated at USD 1,084 m, corresponding to foreign capital inflows (USD 4,689 m), Colombian capital outflows (USD 2,610 m), payments from residents to non-residents for losses in financial derivatives transactions (USD 80 m), and the increase in foreign reserves due to balance of payments transactions (USD 914 m) (Graph 2).
Graph 2. Components of Colombia’s Financial Account of the Balance of Payments
Figures in millions of US dollars
Figures as a percentage of GDP
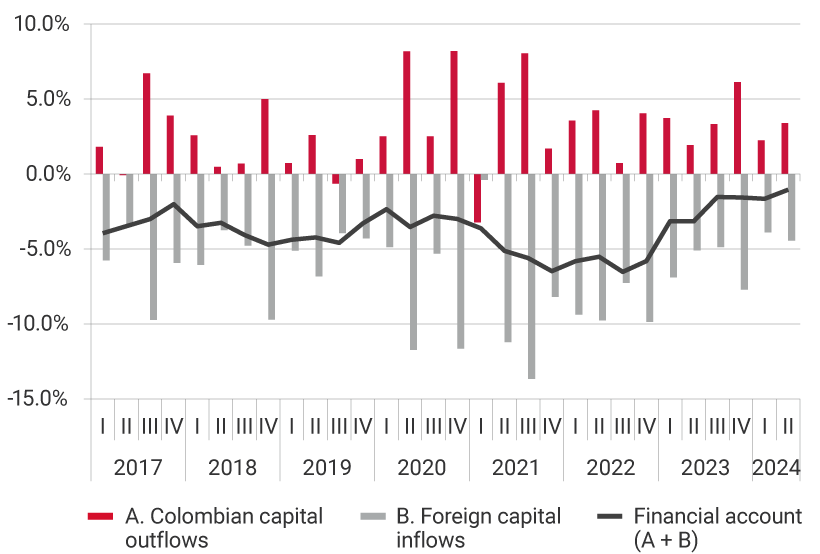
Nota: According to the sixth version of the International Monetary Fund's Balance of Payments Manual, the financial account is presented with the same sign as the current account. For example, if there is a deficit in the current account, the financial account is negative, indicating that the economy is resorting to external financing and/or selling off its external assets to finance its excess current expenditure.
Source: Banco de la República
2. Quarterly and Annual Evolution of the Current and Financial Accounts of Colombia’s Balance of Payments
a) Current Account
The estimated current account deficit for the second quarter of 2024 (USD 1,630 m, 1.6% of GDP) decreased by USD 656 m compared to the immediately preceding quarter, mainly due to the increase in net income from current transfers, lower net factor income outflows, and the lower deficit in the trade balance of goods, partially offset by the negative change in the trade balance of services (Graph 1).
For the January-June 2024 period, the current account deficit (USD 3,917 m, 1.9% of GDP) is lower by USD 1,328 m compared to the same period of 2023, which is mainly explained by the increase in net income from current transfers, the reduction of the deficit in the trade balance of services, and lower net factor income outflows. These results were partially offset by the widening in the goods trade deficit.
b) Financial Account
Net capital inflows of USD 1,084 m (1.0% of GDP) recorded during the second quarter of 2024 in the financial account decreased by USD 600 m compared to the immediately preceding quarter. This result is explained by lower net foreign direct investment inflows, increased deposits abroad, and losses from financial derivatives transactions, partially offset by increases in portfolio investment liabilities and loans.
During the first half of 2024, compared to the same period in 2023, the financial account (USD 2,768 m, 1.3% of GDP) showed lower net inflows of USD 2,479 m, mainly explained by lower net foreign direct investment inflows and higher net outflows for Colombian direct investment abroad, as well as greater accumulation of reserve assets. These flows were partially offset by decreased deposits abroad and higher foreign portfolio investment liabilities.
3. International Investment Position (IIP)
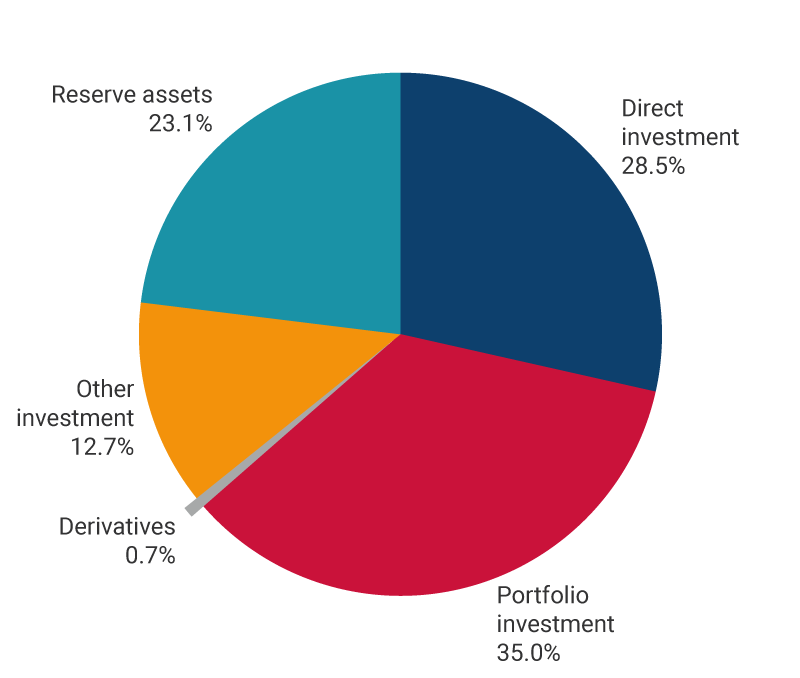
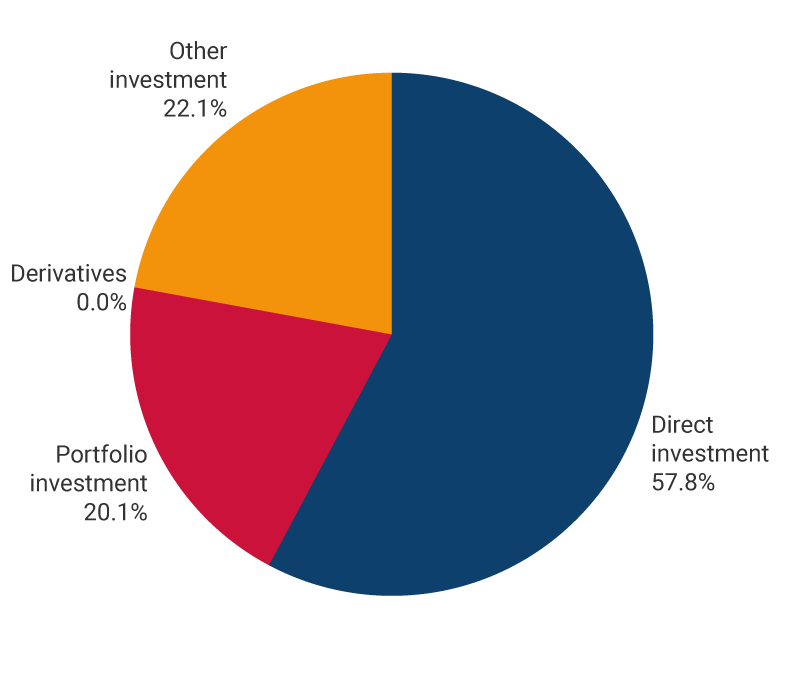
At the end of June 2024, Colombia recorded a negative net international investment position of USD 187,743 m (46.4% of annual GDP), resulting from assets of USD 264,338 m (65.4% of annual GDP) and liabilities of USD 452,081 m (111.8% of annual GDP). Of the total asset balance, 35% corresponds to portfolio investment, 28.5% to Colombian direct investment abroad, 23.1% to reserve assets, and the remaining 13.4% to other assets such as loans, other foreign credits, deposits abroad, and financial derivatives. Liabilities are broken down into 57.8% foreign direct investment, 22.1% other liabilities (where external loans stand out), and 20.1% portfolio investment.
Graph 3. International Investment Position as of June 2024 (USD 187,743 m, 46.4% of GDP 1)
Assets
USD 264,338 m
Liabilities
USD 452,081 m
1 The GDP figure in dollars corresponds to the sum of the last four quarters.