Whenever the monetary authority meets to make interest rate decisions, two key questions need to be answered: Where is the economy at? and Where is the economy headed? Answering these questions is no easy task. On the one hand, the lag in statistical information makes it difficult to have a complete overview so as to answer the first question. On the other hand, uncertainty about the future performance of local and external economic variables limits the accuracy of forecasts to answer the second question. This is one of the reasons why such decisions must be made cautiously, as it is never possible to have a desirable degree of certainty regarding these answers. By using the recently published report from the National Administrative Department of Statistics (DANE in Spanish) on the growth of gross domestic product (GDP) for the third quarter of the year, inflation data at the end of October, and other key indicators, this blog provides an approach to answering these questions.
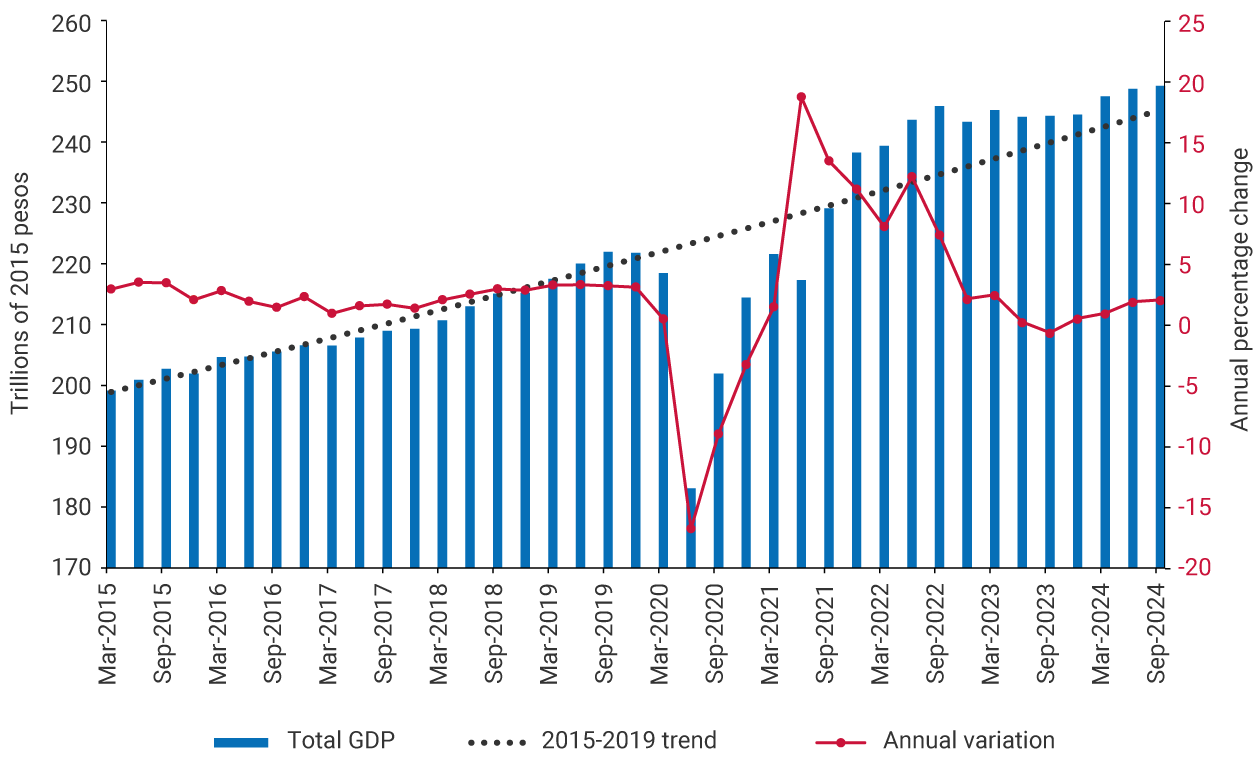
Graph 1 exhibits the seasonally and calendar-adjusted GDP series, which allows for a more accurate monitoring of economic activity. As may be observed, from the fourth quarter of 2023, the Colombian economy began a recovery trend in both GDP levels (blue bars) and its annual variations (red line). Indeed, after GDP contracted by 0.7% in the third quarter of 2023 vis-a-vis the same period in 2022, it expanded by 0.5% in the last quarter of 2023, followed by consecutive annual growth figures of 0.9%, 1.8%, and 2.0% in the first three quarters of 2024. Thus, for the cumulative period up to September, the Colombian economy had achieved 1.6% growth compared to the same period in 2023. Although this is still modest dynamism, it should be considered that this growth was achieved amid the economic adjustment required to bring inflation down to the 3.0% target and moderate excess spending relative to the country's income, which reached a high value in 2022 (6.1% of GDP).
Graph 1. GDP Levels and Annual Variations
(seasonally and calendar-adjusted series)
The economic growth observed has been associated with the gradual recovery of household consumption, mainly in non-durable goods as well as in the expansion of gross capital formation driven by a strong performance in civil works, which in turn has boosted domestic demand, resulting in a 3.9% annual increase in the third quarter of 2024. On the supply side, there has been a mixed performance across productive sectors. Primary and tertiary activities have been leading growth in contrast to the weak performance of secondary activities. Within primary activities, the agricultural sector has shown strong dynamism, with an average annual growth of 8.9% so far this year through September, and 10.5% growth in the third quarter. Among tertiary sectors, notable performances have been observed in artistic and entertainment activities, public administration services, and recently, financial and insurance activities. In contrast, secondary activities have been affected by the continued contraction in the manufacturing industry, although at increasingly lower rates (-0.9% annually in the third quarter). Additionally, the contraction in buildings, particularly in housing, has affected the performance of the construction sector; however, this has been offset by strong growth in civil works, which expanded by 16.6% in the third quarter compared to the same period of the previous year.
In the context of a moderate strengthening of domestic demand, consumer price inflation has continued its convergence process toward the 3.0% target throughout 2024. Thus, by the end of October, annual inflation stood at 5.4%, nearly four percentage points (pp) lower than that recorded at the end of 2023 (9.3%) and less than half of the peak it reached in March of the previous year (13.3%) (Graph 2).
Graph 2. Annual Consumer Price Inflation
(percentages)
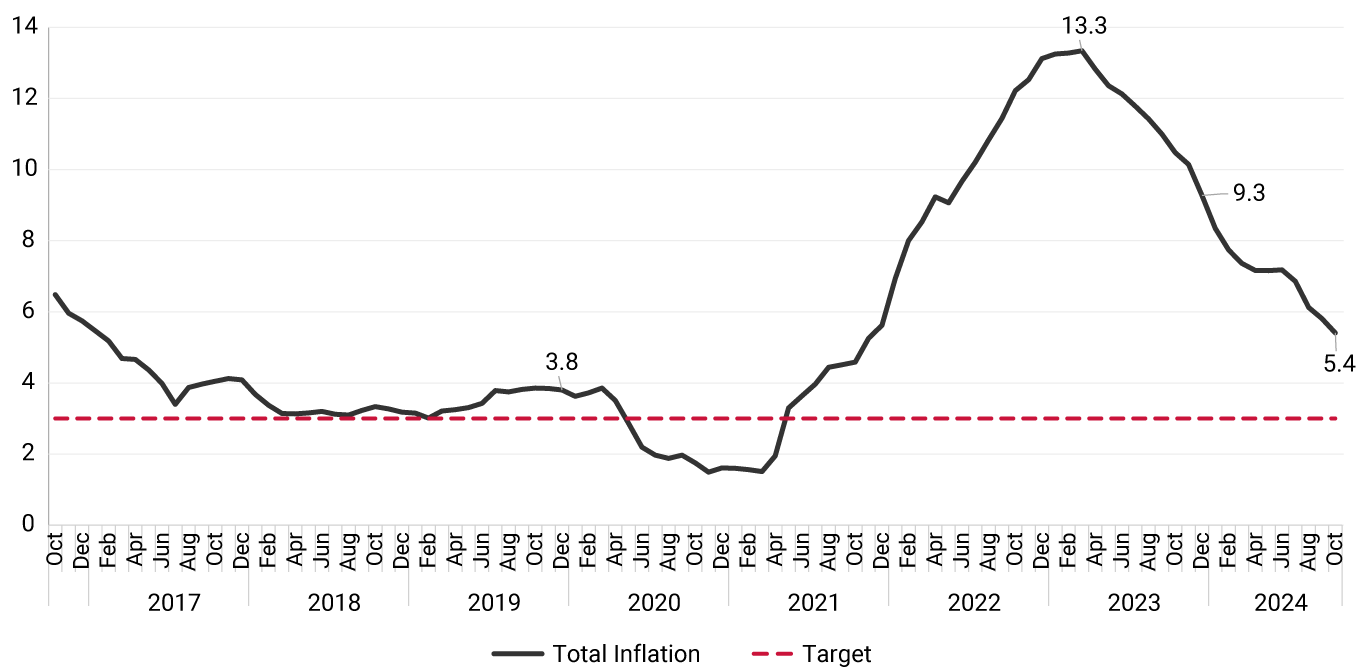
The reduction in headline inflation between the end of 2023 and October 2024 has been led by the decline in food inflation (from 5.0% to 1.7%) as well as by the decrease in regulated inflation (from 17.2% to 9.5%). Core inflation, excluding food and regulated items, has also decreased (from 8.4% to 5.4%), although at a slower pace than headline inflation. This is explained by the relative rigidity of service inflation compared to the flexibility of goods inflation. While service inflation only decreased from 9.0% to 7.3% by October 2024, annual goods inflation fell from 7.1% to 0.4% during the same period. This is because service inflation, which includes significant categories such as rents and dining out, tends to be more indexed to inflation expectations, which are largely influenced by observed inflation. In contrast, goods inflation has benefited from lower international prices and the moderation of domestic demand.
Monetary policy is often said to be more of an art than a science. This statement may be true if we consider the uncertainty surrounding interest rate decisions, through which monetary policy pursues two fundamental objectives: inflation around its target and economic growth around its potential. This balance can be disrupted by supply and/or demand shocks, such as those that have occurred in Colombia in recent years. The task of the monetary authority is to manage the policy interest rate to restore this balance while minimizing the costs in terms of economic activity.
Graph 3. Monetary Policy Rate (MPR) vs. Interbank Interest Rate (TIB in Spanish)
(percentages)
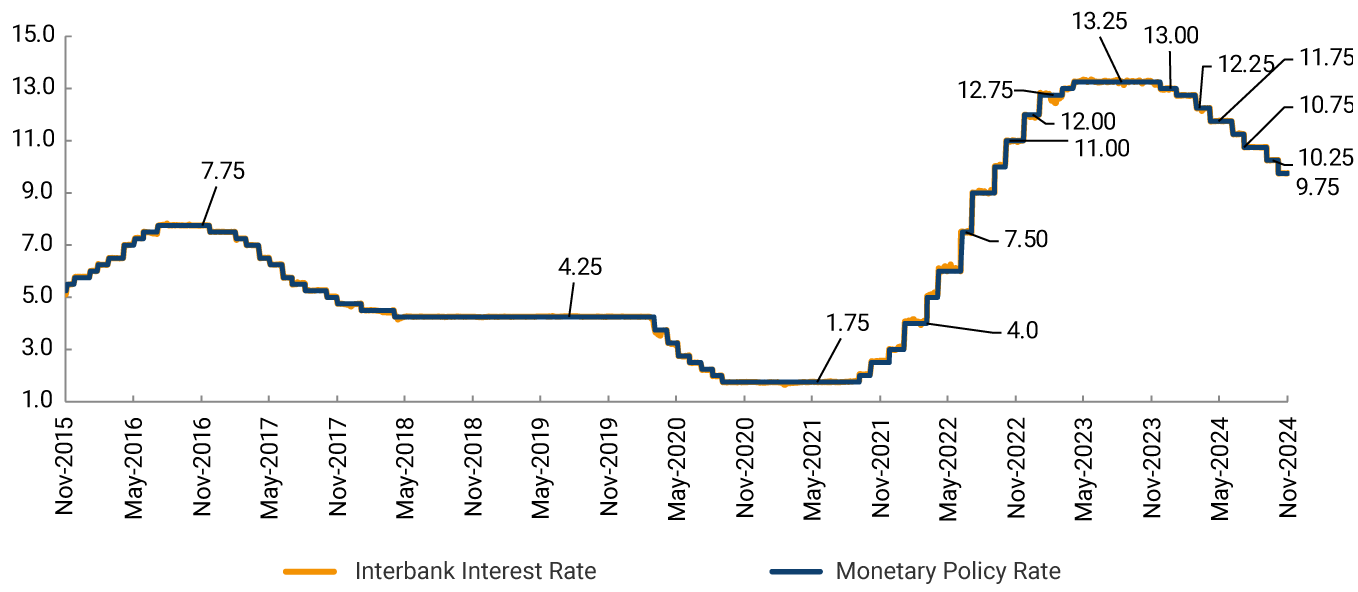
Graph 3 exhibits the recent evolution of the interbank interest rate for overnight loans between financial institutions (TIB), which is primarily defined by the decisions made by the Board of Directors of Banco de la República (the Central Bank of Colombia) regarding the monetary policy rate (MPR). These decisions were aimed at achieving the previously mentioned monetary policy objectives, always with caution due to the uncertainty resulting from the lack of exact answers to the two questions raised at the beginning of this blog.
The progressively contractionary monetary policy stance adopted as of September 2021 helped moderate the economy’s growth, thus addressing excess demand that emerged from the strong expansion of economic activity following the pandemic. As shown in Graph 1, economic growth gradually slowed, as required by the adjustment process. However, it is noted that during this adjustment period, there was no economic recession, which is something usually associated with two consecutive quarters of economic contraction. More importantly, the dashed line in this graph shows that, despite the adjustment process, the levels of economic activity in 2022, 2023, and into 2024 remained above what they would have been in the absence of the pandemic, had the pre-pandemic growth rates been maintained. This highlights the efforts made by the Board of Directors to minimize the sacrifice in terms of economic activity throughout this period. Graph 2 exhibits that this adjustment is yielding results, significantly reversing the inflationary process that is expected to continue into 2025. This has allowed the Board to make progress during 2024 in easing monetary policy, which is still ongoing but is already showing signs of a gradual recovery in economic growth.
The outlook for 2025 points to a growth of 2.9% for the Colombian economy, very close to its potential, and a convergence of inflation to its 3.0% target by the end of the year. This is expected to mark the end of one of the most complex periods for the Colombian economy and one of the most challenging for the Board of Directors of Banco de la República.


