Recently, the National Administrative Department of Statistics (DANE in Spanish) published updated vital statistics data for the country, exhibiting a 14.6% decrease in births during the first four months of 2024 compared to the same months in 2023. This decline is more pronounced than the 11% decrease observed throughout 2023 vis-à-vis 2022, or the 7.0% decline seen in 2022 vis-à-vis 2021. Additionally, based on data from Migración Colombia, the Conflict Analysis Resource Center (Centro de Recursos para el Análisis de Conflictos or CERAC in Spanish) has estimated net negative migration of approximately 550,000 people in 2022 and 450,000 in 2023, excluding irregular migration.
The observed decline in births implies an unprecedented drop in the fertility of the Colombian population, which, together with emigration, suggests that the Colombian population may have decreased in 2022 for the first time in recent history and would have done so in 2023. It is worth noting that DANE has not yet incorporated these new data into the country's projected population tables, which forecast that population growth will turn negative for the first time in 2052.
Given the importance of the country's demographic structure for understanding its macroeconomics, this Banrep Blog entry presents a straightforward exercise to illustrate the magnitude of recent demographic changes on population growth projections. To this end, different scenarios are considered, primarily varying in the persistence of the decline in the birth rate. This rate corresponds to the ratio of the number of births in a given year to the population estimated at the end of the previous year.
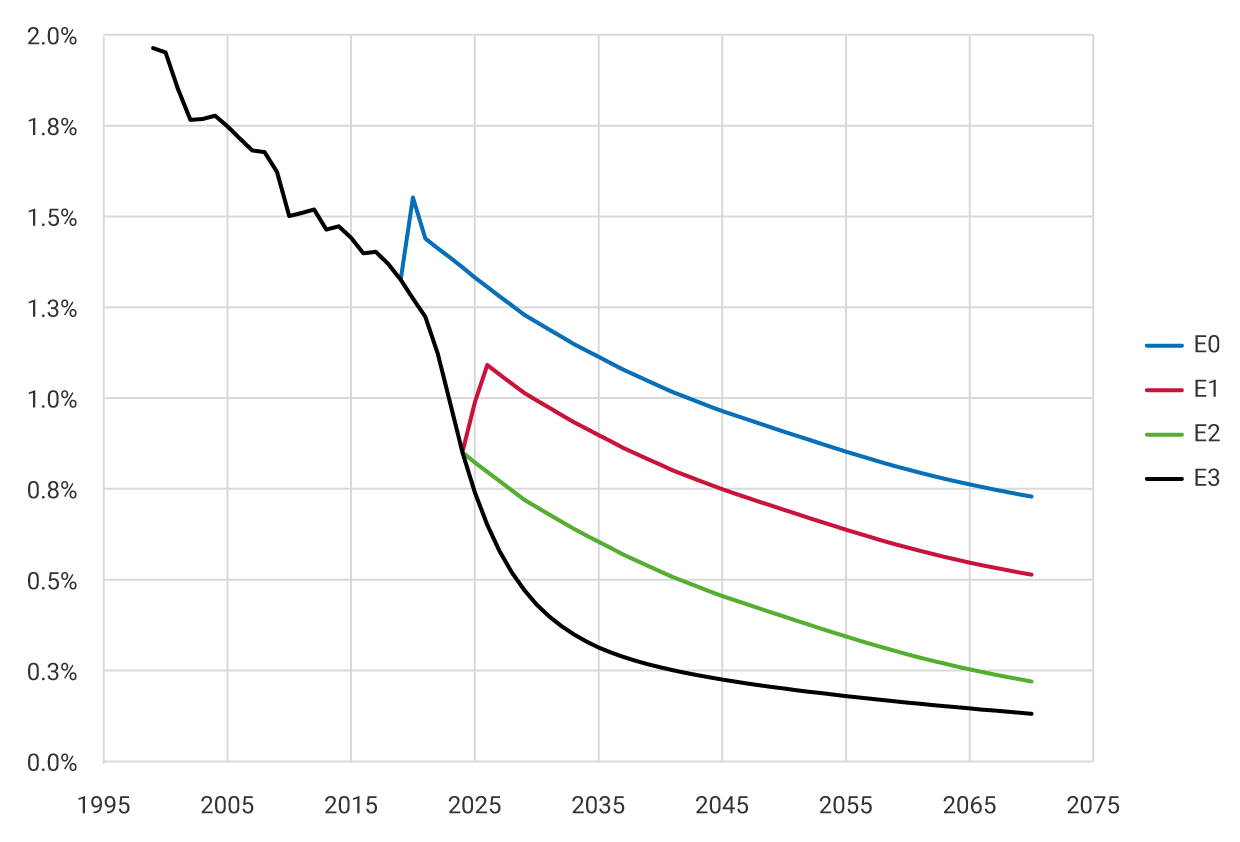
Graph 1 presents the scenarios considered for the evolution of the birth rate up to 2070. Four scenarios are considered, starting with the initial scenario (E0, blue line), which corresponds to DANE’s current projections. As previously indicated, these projections are outdated compared to observed data since 2020, when DANE’s projection implied a birth rate of 1.5% compared to an observed rate of 1.27%. For 2023, the projected birth rate was 1.39%, which was higher than the observed rate of 0.99%.
The alternative scenarios (E1 to E3) consider the observed birth data up to April 2024. The first scenario (E1, red line) further assumes that the current birth decline rate is temporary and that it will reverse along 2025 and 2026. Subsequently, the decline continues at the same rate as originally projected by DANE. It is worth mentioning that international experience does not exhibit reversals of this magnitude in birth rate declines.
The second alternative scenario (E2, green line) incorporates observed data but assumes that the temporary decline does not reverse but returns immediately to the same decline rate originally projected by DANE. The third alternative scenario (E3, black line) assumes that the decline in birth rates is a persistent phenomenon, resulting in a decline rate that is higher than originally projected for several years before stabilizing.
Graph 1. Birth Rate
These birth rate scenarios, along with projections for death rates and net migration rates, allow us to calculate the corresponding scenarios for population growth projections. Graph 2 presents these scenarios and adds one more (E4, yellow line), which adds a negative net migration rate of -0.8% to scenario E3, maintaining a negative rate for several years but converging rapidly (within less than ten years) to zero. This net migration rate corresponds to 400,000 people in 2022, similar to the observed data that DANE has not yet incorporated into its population estimates.
As shown in Graph 2, population growth peaks in 2019, corresponding to the estimated peak of Venezuelan migration, which has since been estimated to decline. It is worth noting that much of the Venezuelan migration is irregular and not officially recorded. In recent years, this irregular migration also includes flows of individuals returning from other South American countries or migrating to North America via the Darién. Due to the lack of data, the impact of these irregular flows is not included in this analysis.
The graph displays population growth projections under the different scenarios described. In the original projections (E0), a population decline is expected to begin in 2052. In the alternative scenarios E1, E2, and E3, the decline would start in 2043, 2032, and 2027, respectively. In scenario E4, which includes migration data and is closest to observed data up to 2024, the decline would have started in 2022, i.e., 30 years earlier than expected in DANE’s current population tables.
Graph 2. Population Growth Rate

The rates illustrated in Graph 2 are annual change rates, with effects accumulating over time. Thus, the total population in 2050 ranges from 53.9 million in the alternative scenario E1 to 45.4 million in scenario E4. It is also important to clarify that these calculations are not forecasts, rather quantifications of hypothetical scenarios based on observed data illustrating the magnitude of the country's demographic risk in the coming decades.
This exercise is a simple aggregate analysis, without detailed calculations of fertility by age cohorts. A more comprehensive approach would model the fertility evolution of each cohort and incorporate information on the demographic structure of the migrant population. Additionally, potential changes in mortality, which might mitigate the negative impact of declining fertility on the total population but increase its aging, should be considered.
The detailed study of these aspects of the current demographic transition is part of the Central Bank’s research agenda aimed at understanding some of its impacts on the economy. In particular, the demographic transition is expected to have substantial effects on the economy’s productive capacity, public finances, and demand for public goods, making it a central concern for public policy.