Following the enactment of the 1991 Constitution, which increased the fiscal autonomy of subnational governments, there was a growing deterioration of territorial finances, which, in turn, threatened to jeopardize the fiscal position of the Central Government. In response, fiscal rules for subnational governments were introduced in 1997. A recent paper in the journal Ensayos Sobre Política Económica (ESPE in Spanish), written by a group of researchers from Banco de la República (the Central Bank of Colombia), studies the implementation and impact of these measures that preceded the national government's fiscal rule by over a decade.
In order to have an idea of the territorial fiscal situation since the beginning of its deterioration in the mid-1990s, Graph 1 shows, for the period 1993-2020, the total deficit and debt balance as a percentage of GDP for municipal governments (Panel A) and for departmental governments (Panel B). The dashed vertical lines indicate the entry in force of Law 358 of 1997 and Law 617 of 2000, which contain the main subnational fiscal rules.
The graph exhibits the sustained increase in debt for the two types of territorial entities since the beginning of the deepening of fiscal decentralization. For municipalities, it went from 0.30% of GDP in 1995 to 0.85% in 2002, while for the departments, during the same period, the debt balance went from 0.15% to 0.53% of GDP. Regarding the deficit, there was also a significant deterioration during the same period. Subsequently, this trend stopped and a period of debt and deficit reduction and, generally, recovery of the fiscal sustainability of municipalities and departments began.
Graph 1. Total Deficit and Debt Balance of Subnational Governments
(percentage of GDP)
a. Municipalities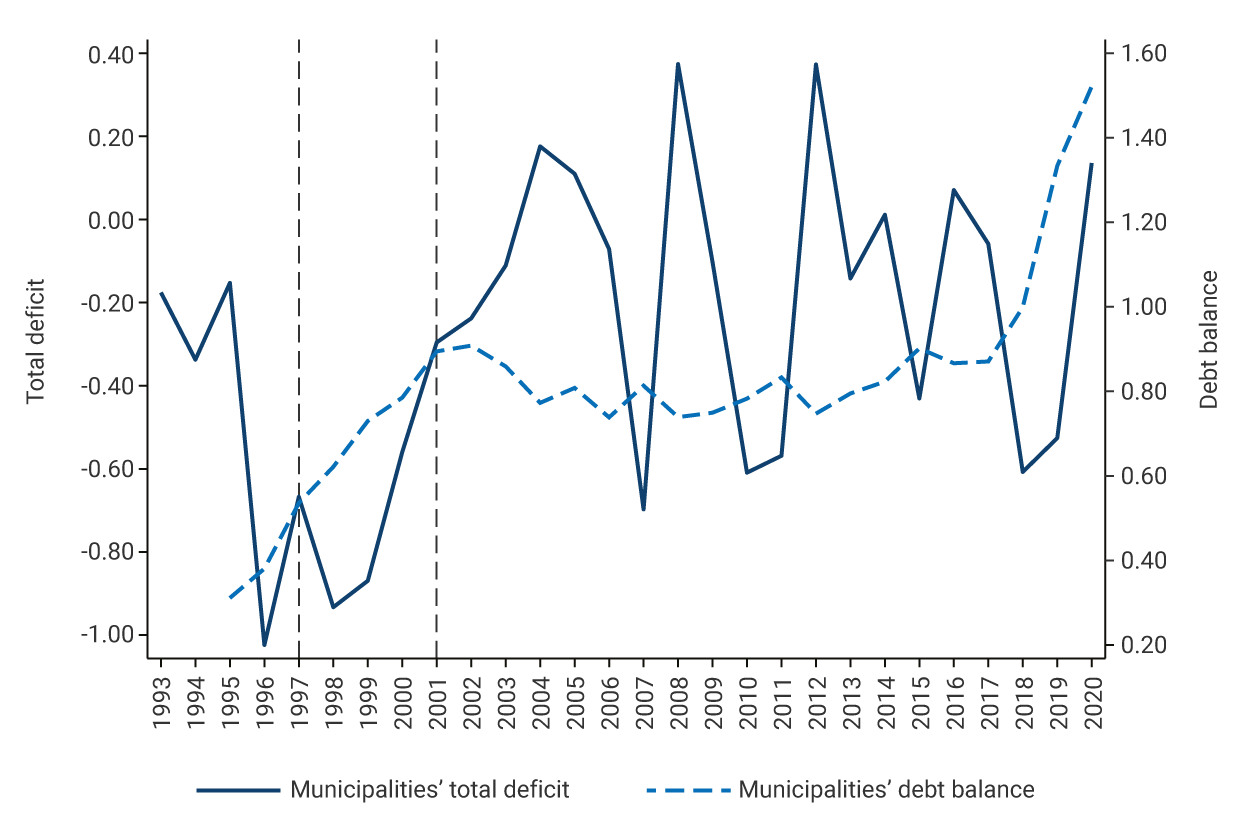
b. Departments 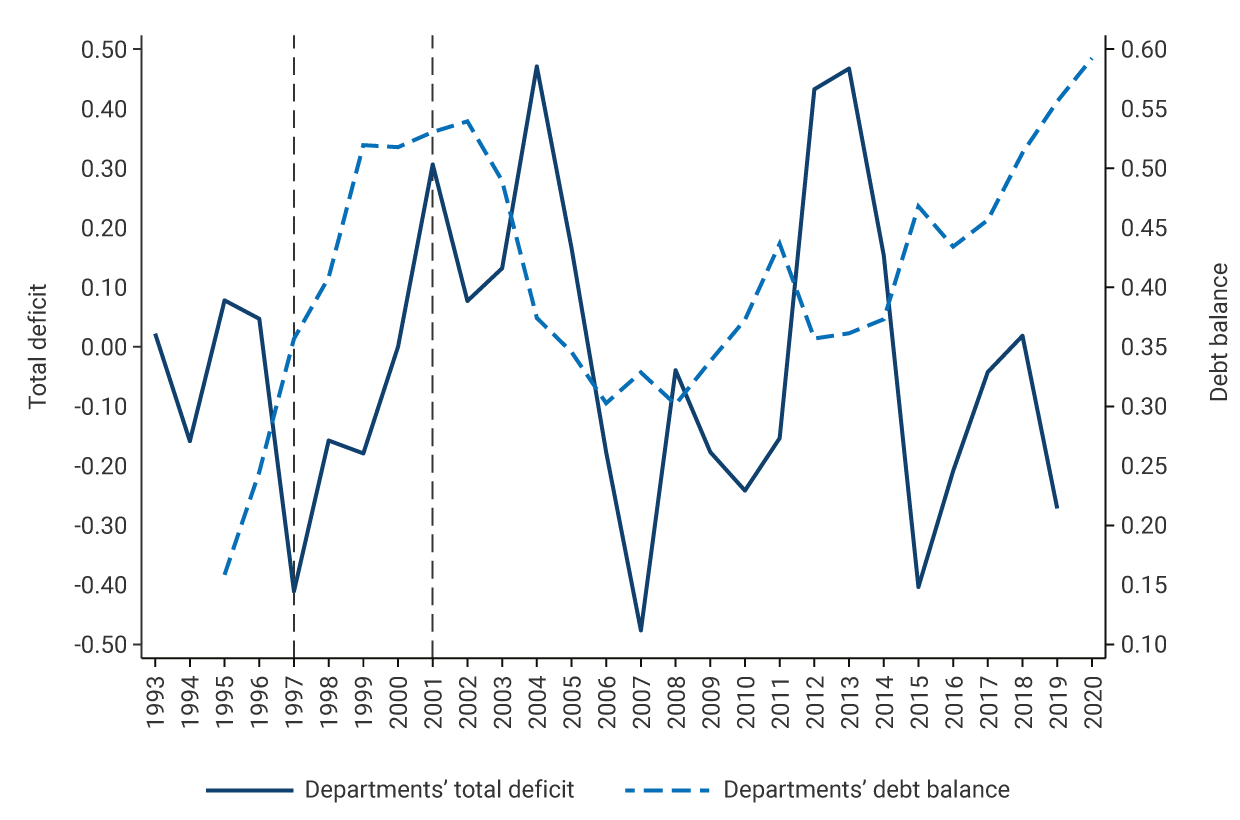
The reversal of subnational fiscal deterioration is associated with fiscal rules. The first rules, established by Law 358, also known as Ley de Semáforos (Traffic-Light Law in English), aimed to set limits on short- and long-term debt through solvency and sustainability indicators. The solvency indicator is calculated as the ratio between debt interest and operational savings and has a ceiling of 60%. The sustainability indicator is calculated as the ratio between the debt balance and current revenues, and it started with a ceiling of 80%. Subsequently, Law 617 of 2000 set a limit on the level of operating expenses relative to unrestricted current revenues. This rule encourages subnational governments to increase their own collection in order to increase their current expenses and stay within the limit established by the restriction.
Graph 2. Indicators of Law 358 of 1997, 1994-2020
(percentages)
a. Solvency indicator 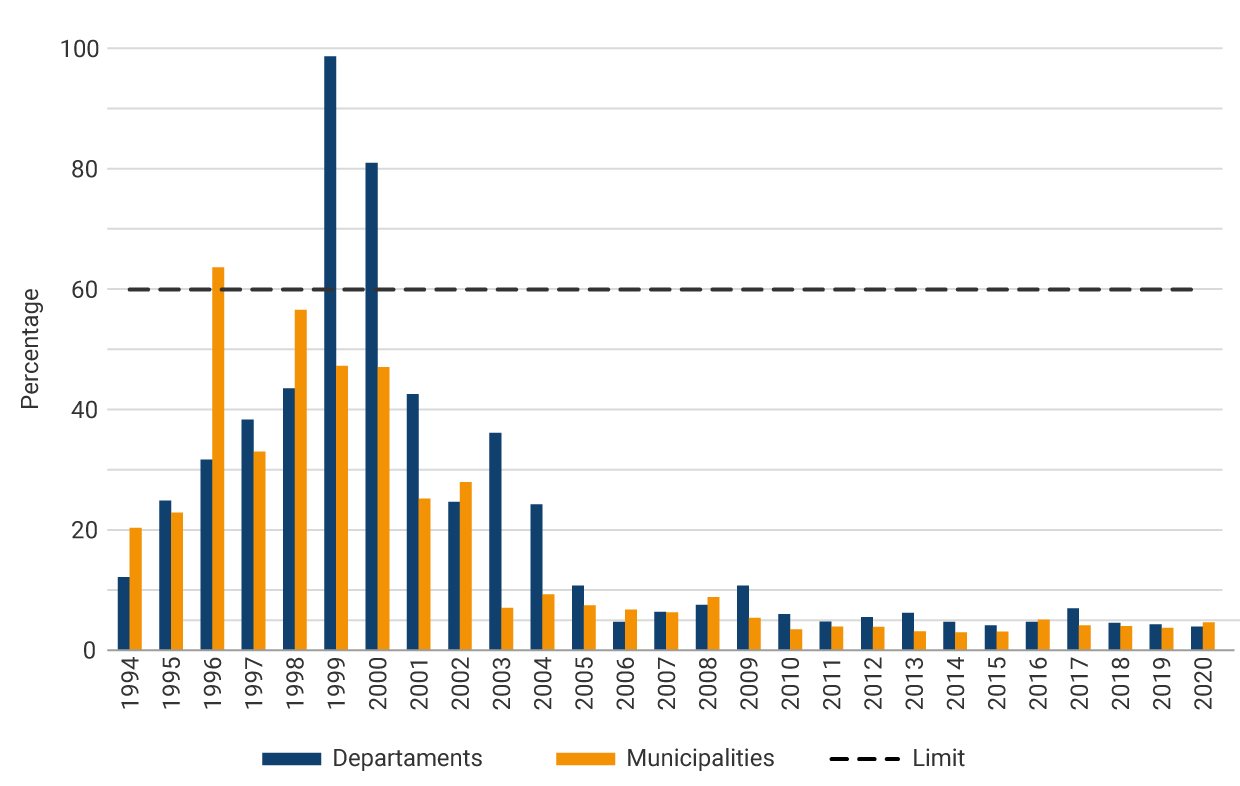
b. Sustainability indicator 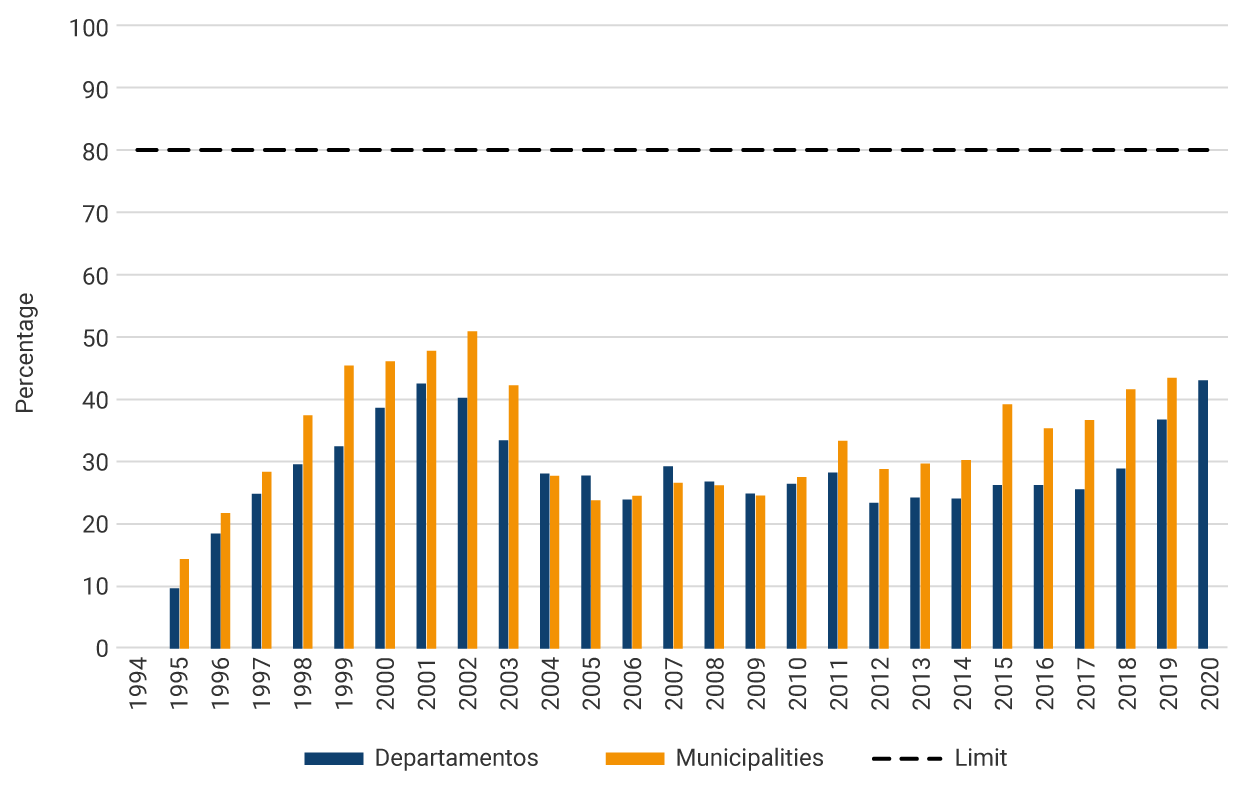
Graph 2 shows the evolution of solvency and sustainability indicators between 1994 and 2020. As can be seen, the evolution of these indicators is consistent with the evolution of the fiscal situation illustrated in Graph 1. It can be seen that there was indeed a decrease below the limits imposed by Law 358, especially as of 2000, when Law 617 came into force. Since then, and thanks to the rules described in the ESPE paper mentioned above, the fiscal indicators of subnational governments have remained stable and have not jeopardized the fiscal position of the central government.